House Price Prediction
Published: February 9, 2022
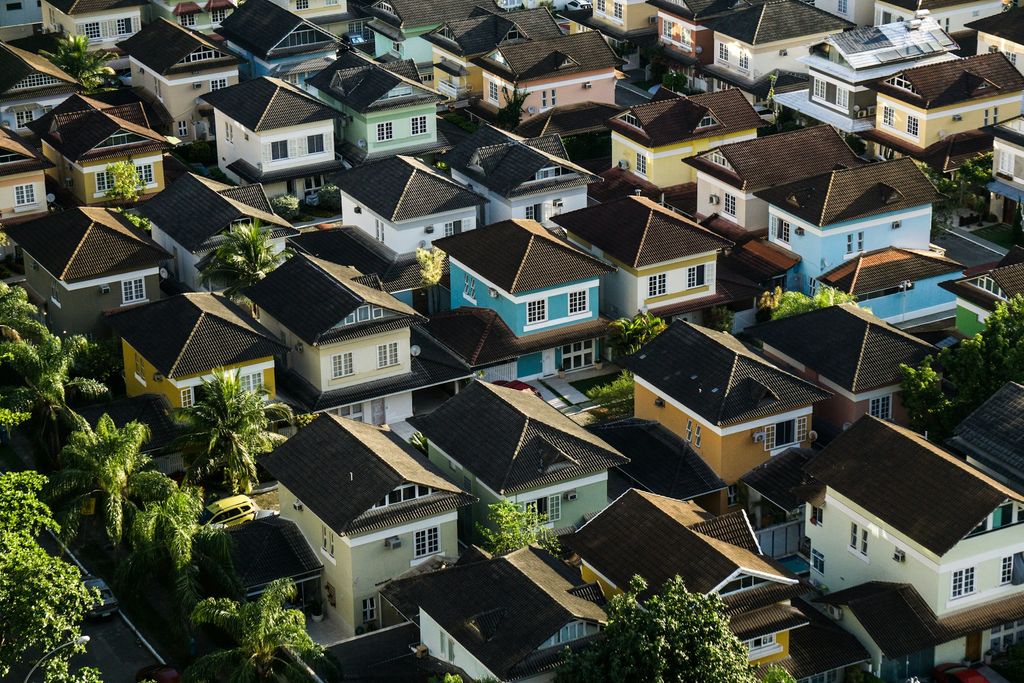
The contract with my current apartment is almost over, and I’m looking for a new place to throw amazing dinner parties. I first thought, like a normal person, to check places online and visit a real estate agent to show me places. But that would be too boring, I told to myself, I’m a data scientist so I should know better.
Objective
Our objective is to find the most underpriced house in Tokyo in a quick fashion as I need to move out by the end of March 2022! Lest I become homeless, we go with one of the simplest machine learning models: regularized linear regression (ridge regression). We use regularization because some variables need to be one-hot encoded and we don’t want coefficients to explode.
Another reason we go with linear regression is that we want to build a relatively explainable model to understand the drivers behind house prices. (Sorry multilayer perceptron, you will be my favorite no matter what)
Method
We will run a linear regression to predict the monthly rent for each house based on a set of independent variables. The house with the largest positive error (the most over-predicted house) will be the most under-priced house as our model gives a large prediction but the actual price is low. This house will be a no-brainer, and maybe my next house?
Data procurement
I wrote a piece of code and scraped 217,389 houses from several real estate websites in Tokyo. The original data were so messy so I’m gonna spare you the data processing steps. Finally, the data for each house includes below:
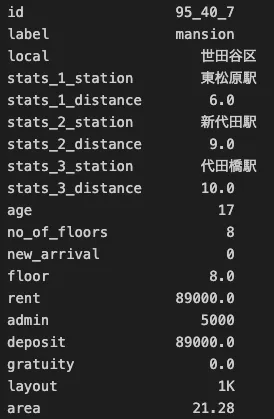
- id: Unique identifier of each house assigned in pre-processing
- label: Shows house type: single house, condo, etc.
- local: Shows the locality of the house: Cities (23 wards) and suburbs of Tokyo
- stats_1/2/3_station/distance : Shows the nearest (or 2nd, 3rd nearest) station to the house and walking distance to the station (minutes)
- age: Age of the building
- no_of_floors: Total # floors of the building the house belongs to
- new_arrival: Whether the house is newly listed on the website
- floor: Floor of the house
- rent: Monthly rent of the house
- admin: Monthly administration fee (管理費)
- deposit: You know what this means
- gratuity: One-time fee that you need to pay to the house owner to show that you are grateful for moving to their house (makes no sense right?) (礼金)
- layout: Layout of the house. Think of this as 2 bedrooms, 3 bedrooms, etc.
- area: Square meter area of the house
Modeling
In our model, the dependent variable will be (rent + admin) because that’s what you pay monthly. Our independent variables will be age, floor, no_of_floor, area, and local (Locality: city within Tokyo area). The locality will be one-hot encoded.

Results - 1: Overall
We look at actual vs. predicted house prices:
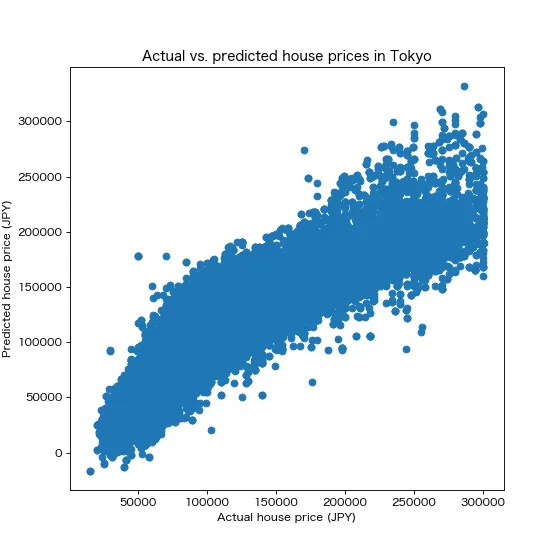
R2 of the model stands around 84%, which is not bad considering we were able to implement this model within 5 minutes. You can see that predictions are curving with respect to actual prices. I’m pretty sure non-linear models like deep learning would give us very high R2 (Welcome back multilayer perceptron!)
Results - 2: Drivers of house prices
We now look at how each variable is contributing to the predictions:
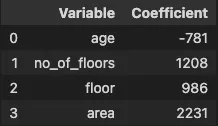
As you can see above, as the building gets older, the rent goes down ~800 JPY (7 USD) per year.
An interesting point is that the total # floors (~1,200 JPY, 11 USD) that a building has is more influential compared to the actual floor (1,000 JPY, 9 USD) of the house. So it’s best to find houses in short buildings that are near the top floor if you are looking for a high floor. (E.g. 10th floor of a 10-story building should be cheaper than 10th floor of a 20-story building)
The most important outcome from this model is that, 1m2 of house area costs ~2,200 JPY (20 USD) in Tokyo. Not bad huh!
In addition to the above variables, we have one-hot encoded the locality (city) of the house fed it to the model. Looking at the coefficients we get for the one-hot encoded variables, we can understand the housing premium for each city within Tokyo. Can you guess the most expensive city (区) in the Tokyo area? Below it is:
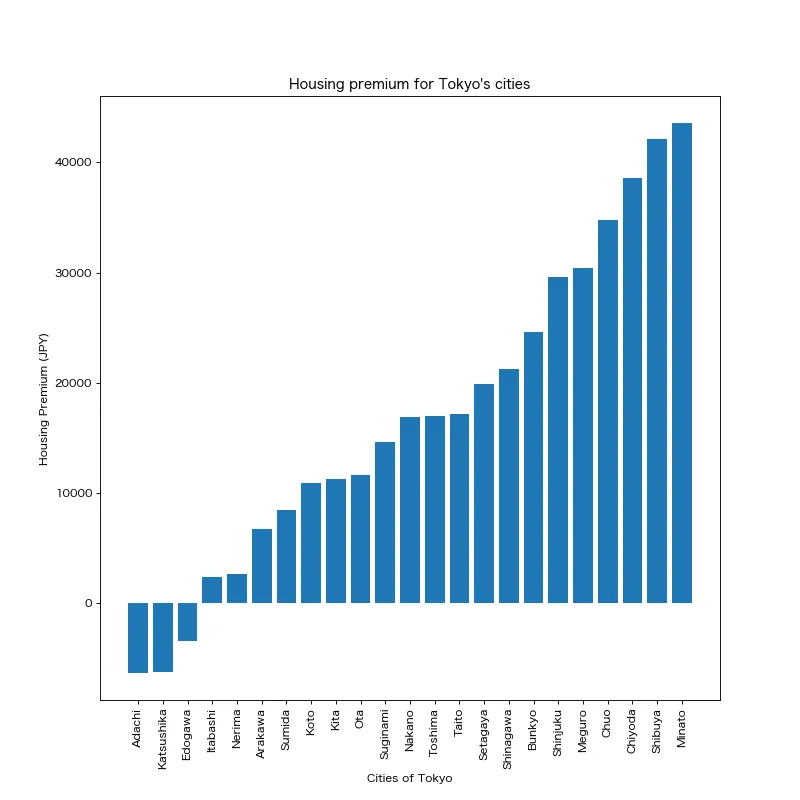
Minato is the most expensive city to live in the Tokyo area as you need to pay ~40k JPY (350 USD) monthly just to live in this city. It is followed by Shibuya, Chiyoda, and Chuo. On the other hand, there are some cities within 23 wards that are less expensive compared to suburbs. E.g. Adachi is less expensive compared to Kunitachi (not shown above as it is not in 23 wards) while Adachi is more central. It would make a lot of sense to move to Adachi if you care about access.
Results - 3: The most underpriced house
Now we are in the final stage, to find the insight that caused all this project to start: The most underpriced house. For this, we check the errors between actual and predicted prices. The house with the highest relative error is:
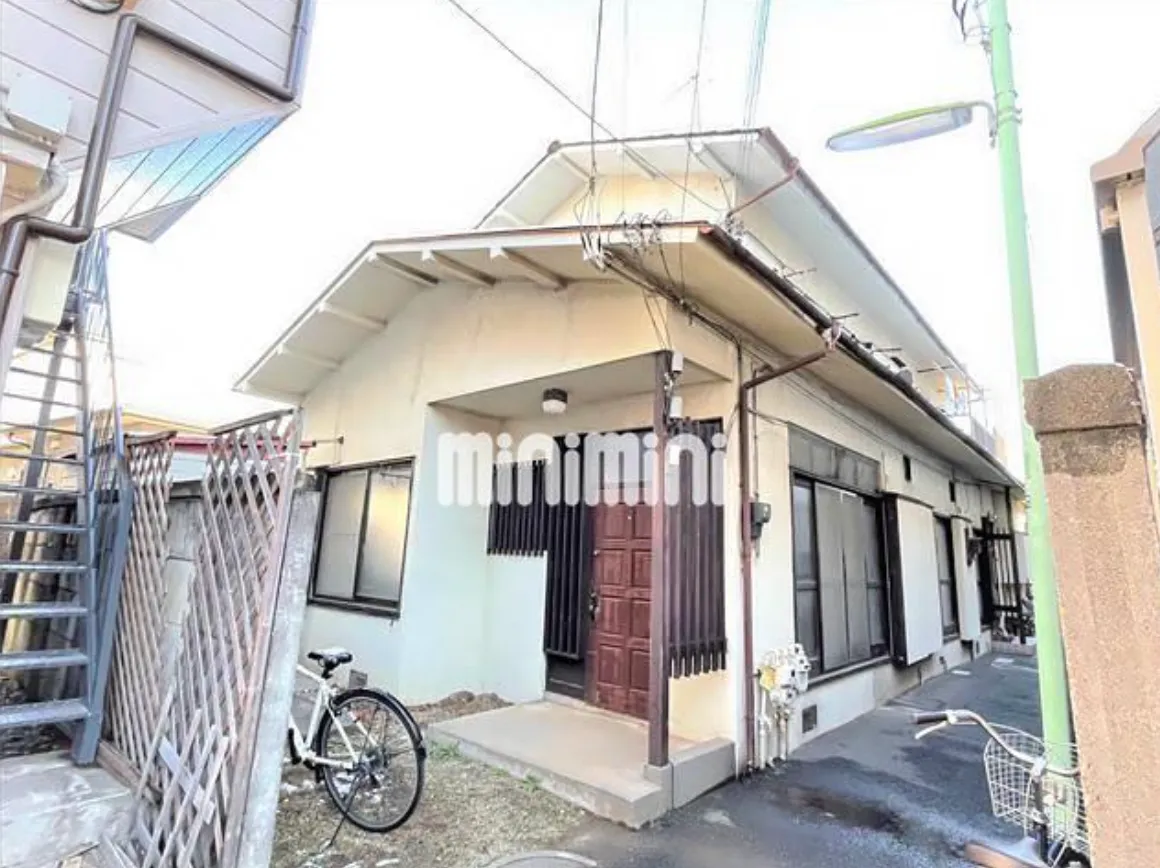
This house’s rent is 50k JPY (430 USD) but our model tells that it should be 178k JPY (1,500 USD)… It indeed looks extremely cheap for a 3DK single house in Shinagawa with 65m2. I guess the model is working but this house is definitely not my style. I will probably be going with a waterfront house looking over Sumida river cause you know, guests at dinner parties won’t be entertained by themselves.

Conclusion
I love using data science for daily tasks such as the topic of this article: finding the most underpriced house to move to. Our simple model did a very good job predicting house prices in Tokyo with 84% R2. However, model results should always be taken with a grain of salt and it is up to the person how to interpret the results.
As the scraped data is very rich, one next step could be building a graph convolutional network using train stations as nodes to predict house prices. This model would take the connectivity of the house into account.
Another future project is to predict the layout (1K, 1LDK, etc.) using the images of the house with computer vision. With this, a significant amount of labor can be cut down.
Quest on!

Leave comment
Comments
There are no comments at the moment.
Check out other works
2025/10/12
Kumamap: Bear Incident Tracker
2025/07/07
YOLO Object Detection

2024/06/03
Kango: Guess The Kanji
2024/07/24
Lingo: Guess The Word

2024/04/29
Druggio

2024/01/28
Tetris

2022/04/29
Moving Object Detection

2022/03/15
Temperature Forecast

2021/12/01
Japan Drug Database

2021/09/20
Japanese Text Classification

2021/09/01
Travel Demand Prediction
