Temperature Forecast
Published: March 15, 2022
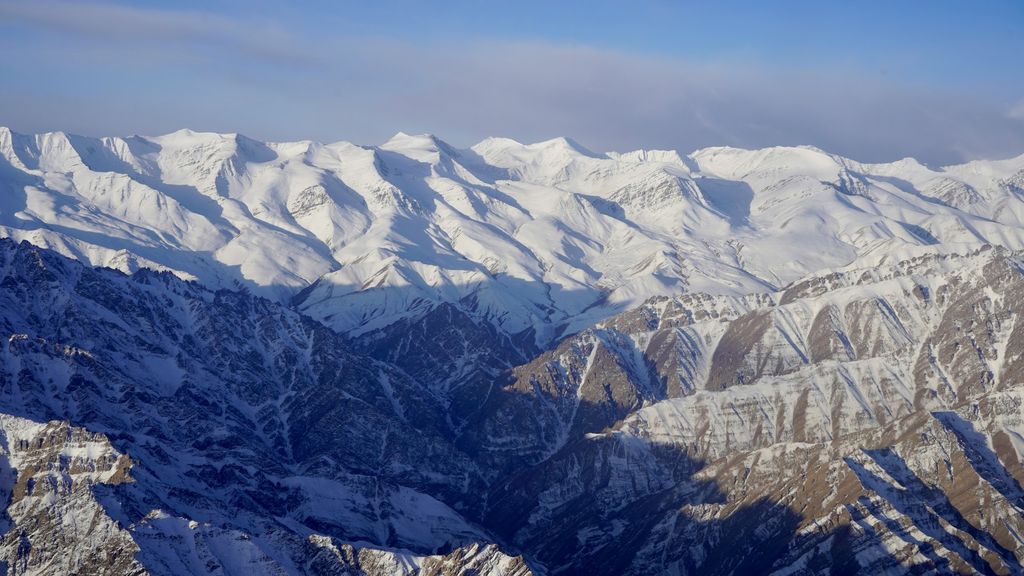
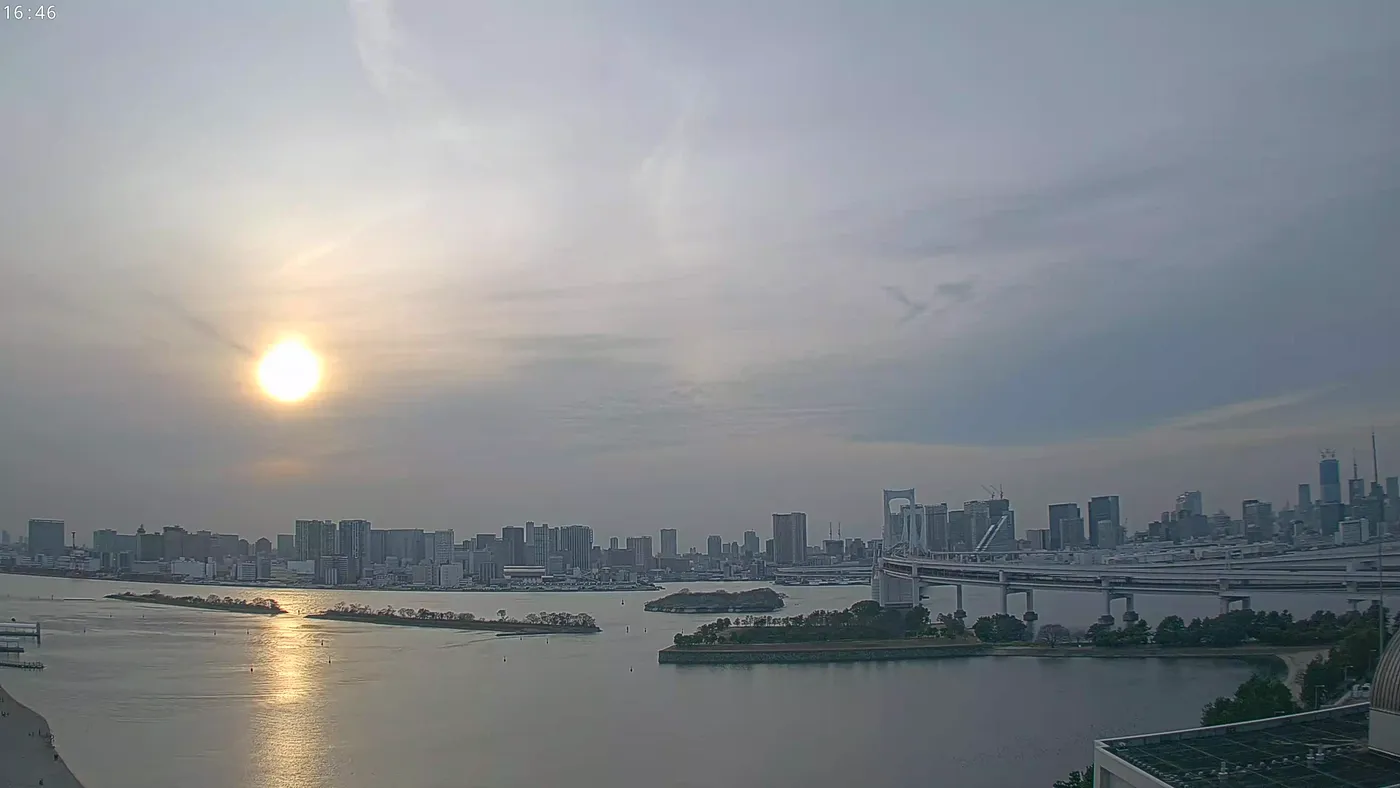
Can you guess the temperature at the below location when the picture was taken?
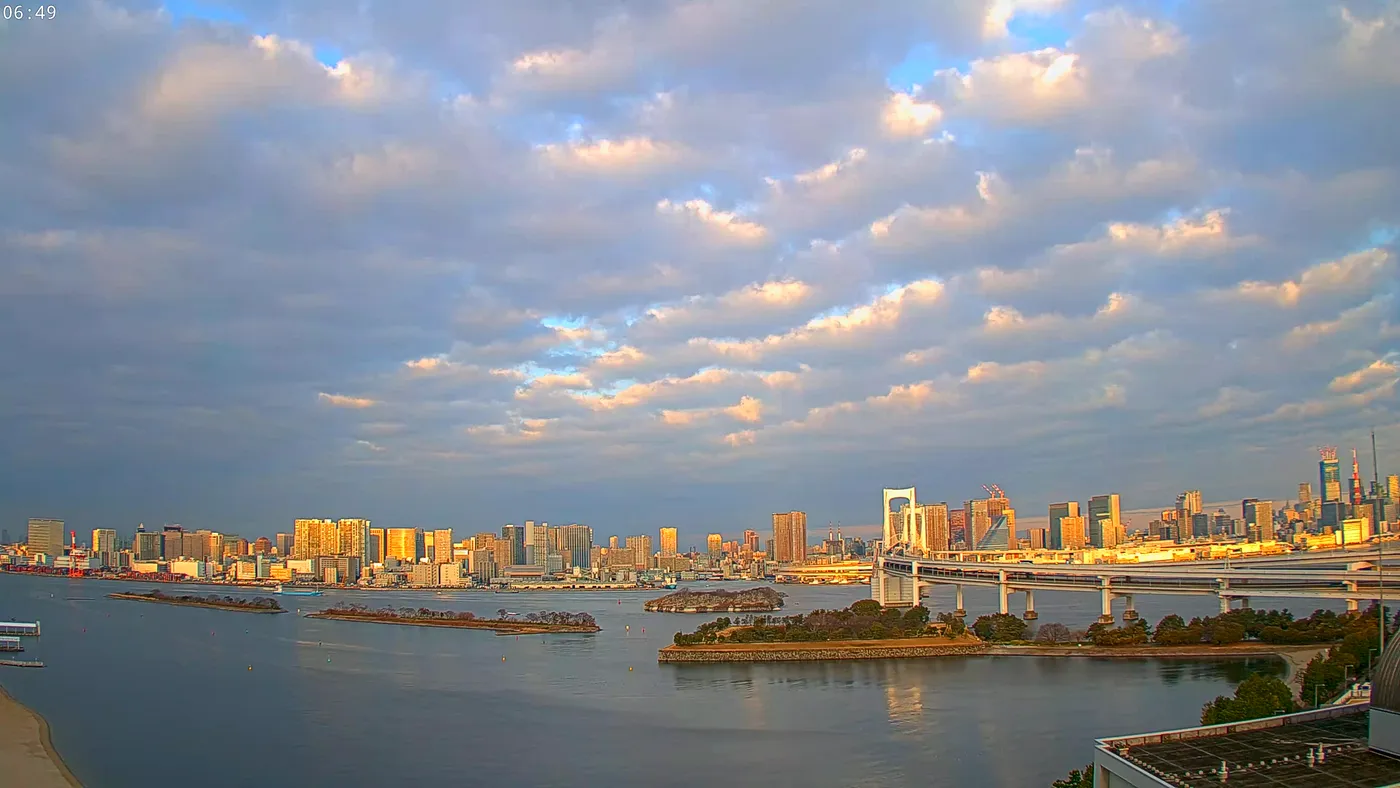
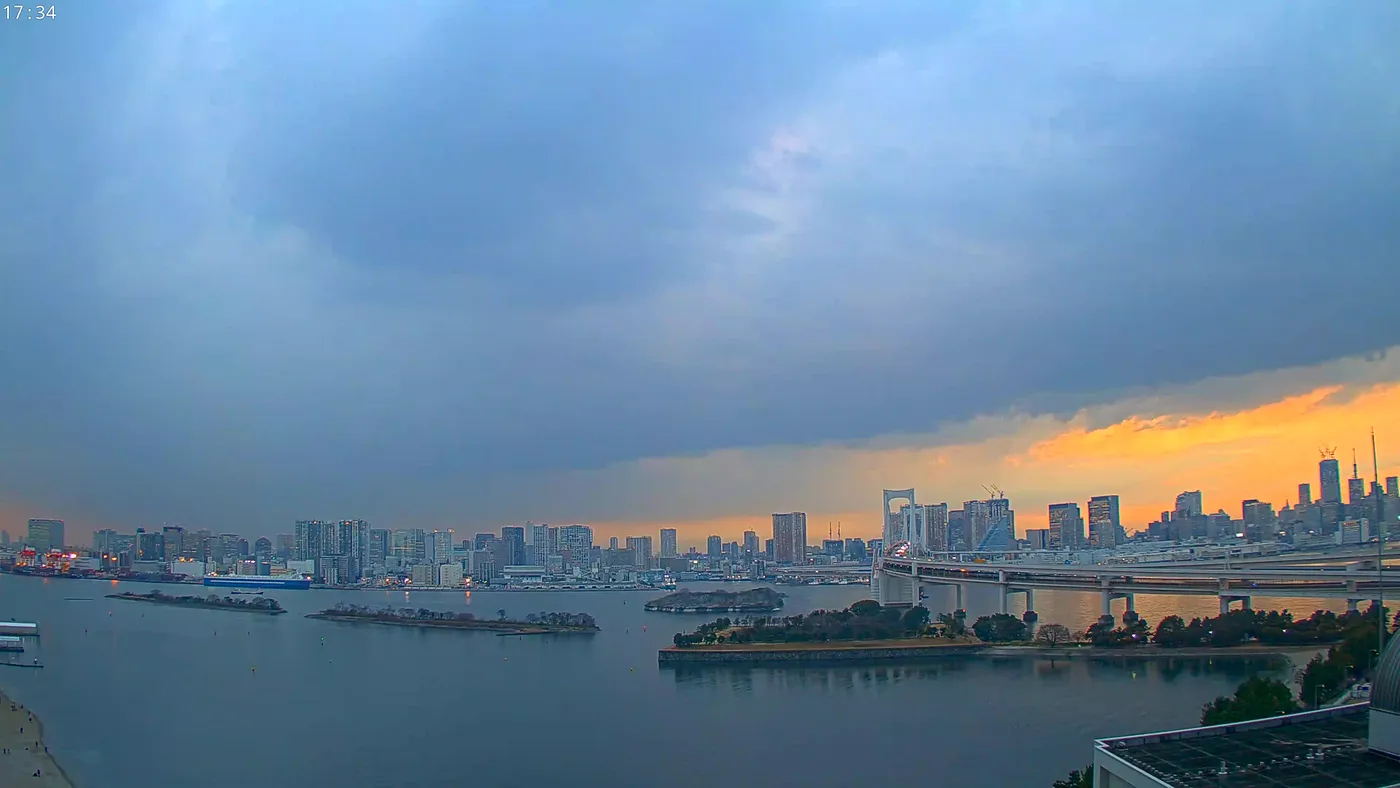
It’s a difficult task, right? This image could be from a cold early morning or a warm late afternoon. The atmospheric temperature would also depend on the season and location. All in all, the atmospheric temperature is a result of many parameters, which make it difficult for us to determine at first glance. For your information, the temperature at the above instance was 5.4 °C.
Objective
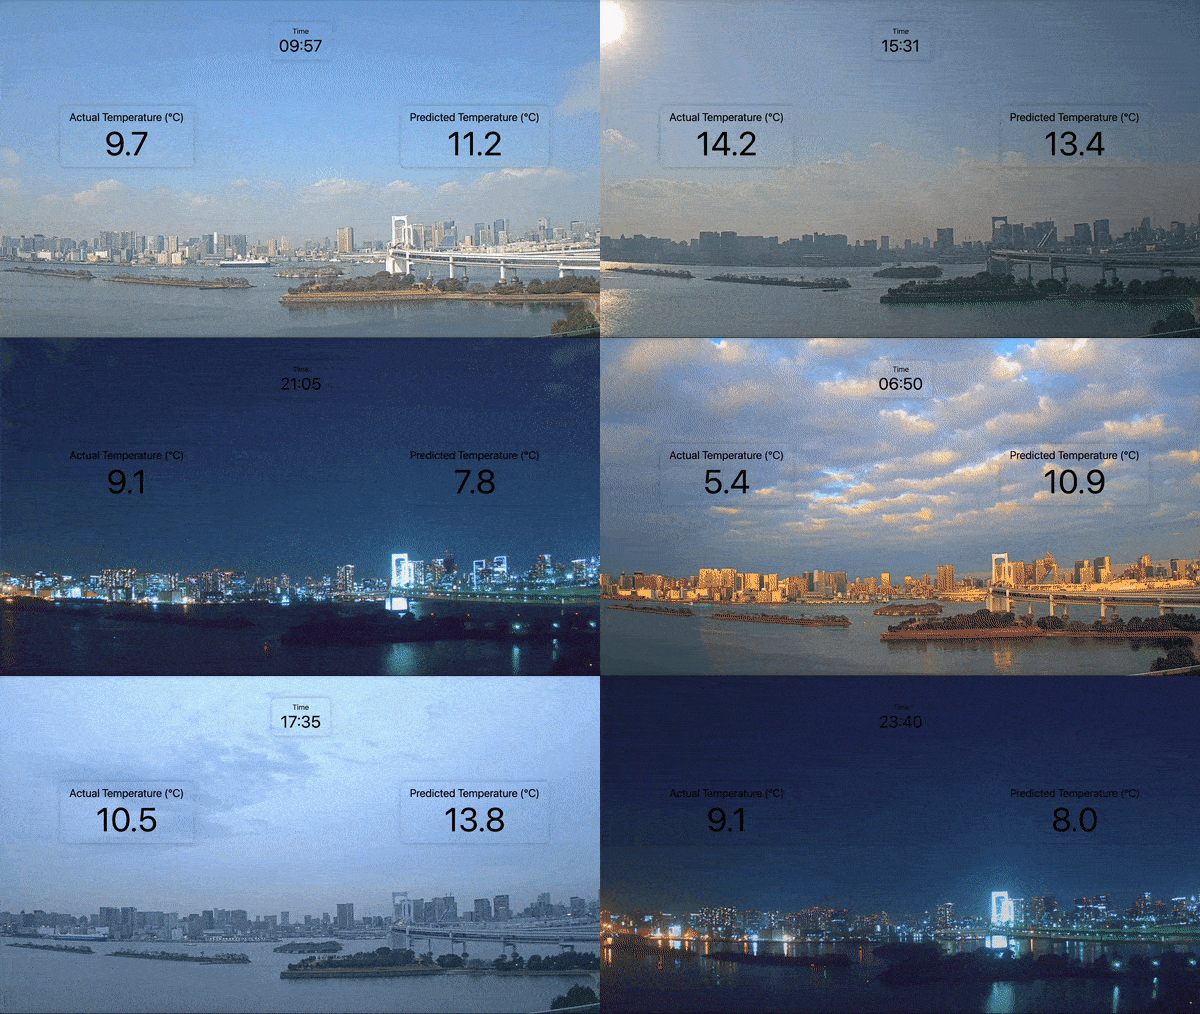
In this article, we will try to estimate the atmospheric temperature at Rainbow Bridge, Tokyo by looking at the images of this location.
Method
We will be using a convolutional neural network to train a model that predicts the temperature at the moment the image was taken. Our task will be a regression task rather than a classification task as our target variable (temperature) is a continuous variable. While image convolution is mostly used for classification problems such as object detection or face recognition, it is not common to use it for a regression task, hence there are not a lot of materials about this online.
Data Collection
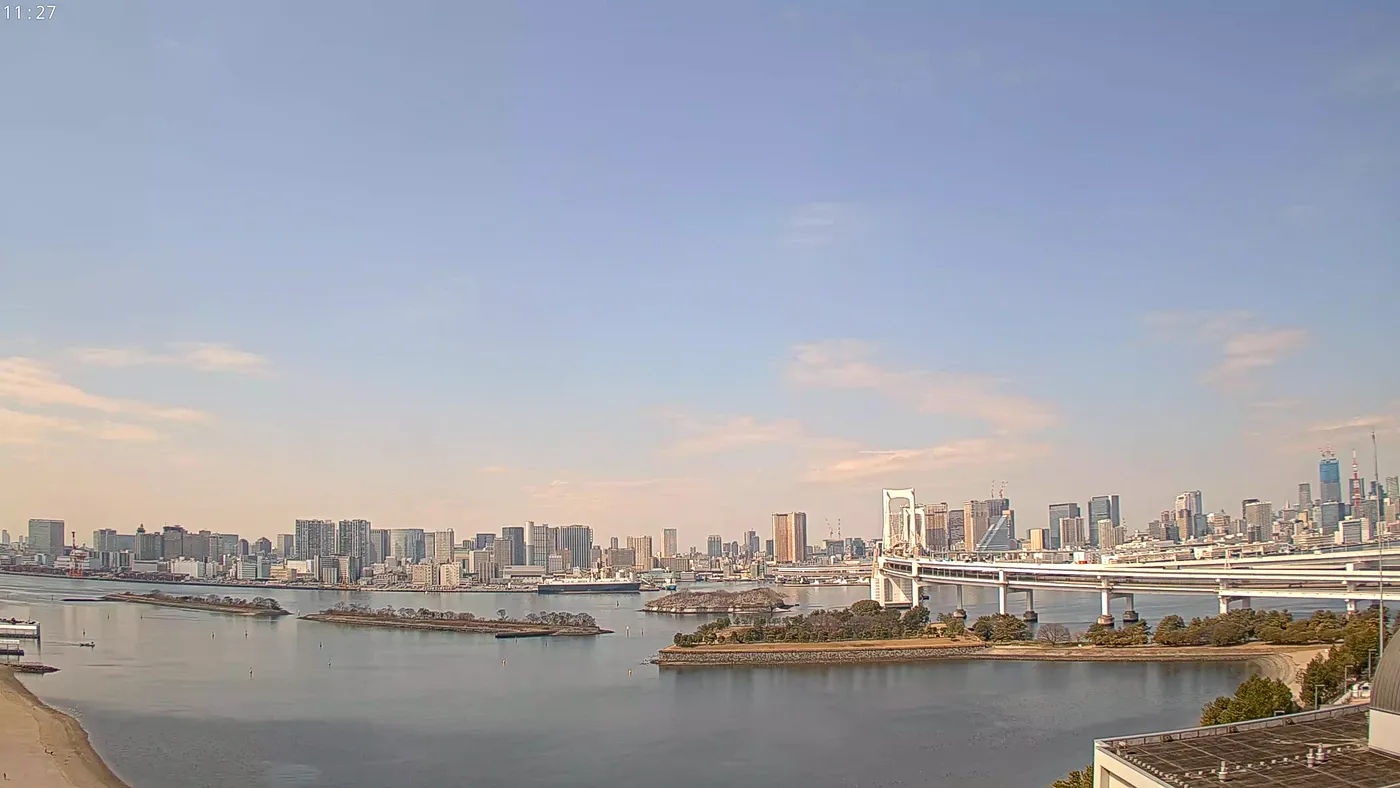
For this task, we will be connecting to Youtube and OpenWeatherMap APIs for collecting images and weather information, respectively. We write a script that connects to Youtube API and takes a screenshot of the Odaiba Live Camera feed once every 50 seconds. Once the snapshot is taken, the script connects to OpenWeatherMap API and gets the weather information at Rainbow Bridge (Odaiba) The collected data is written to our local machine together with a timestamp to link back the image and temperature later. We run the script for roughly 2 days and collect 2k+ images together with the weather information.
Data Processing
When OpenWeatherMap API is requested to provide weather information about a coordinate, it checks the nearby weather stations and provides the latest info. For example, when we query about Rainbow Bridge, we get information from Mita or Shinagawa station depending on the time the query was done. Since we do not want discontinuity in our data (Mita and Shinagawa might have different temperatures at the same time) we narrow down the dataset to information obtained from the Mita station. This leaves us with 1,902 images in total. Image file paths and relevant temperature together with the timestamp are collated into a master data file. This data together with images are uploaded to Google Drive for training the model on Google Colab.
Model
Using 1,902 images of the Rainbow Bridge area, we divide the dataset into training (70%) and test (30%) subsets. A portion of the training subset will be used as a validation subset for early stopping in order to prevent overfitting.
The neural network is made up of 1 input layer, 2 convolutional+MaxPool layers + 1 Global Average Pooling layer + 3 dense layers, and 1 output layer (temperature).
The convolutional layer slides a small window across the image and extracts useful features from the image. In a commonly used example, a convolutional layer can learn to identify edges in an image. Applying MaxPool right after the convolutional layer is common practice for downsizing the output. We then apply the Global Average Pooling layer to reduce the image to a 1D vector. This 1D vector is moved through a standard 3-layered multilayer perceptron with a ReLu activation function that will give us the temperature as 1 value from the image.
We use GPU acceleration on Google Colab for faster learning. The first epoch will take a relatively long time as tensors are moved to GPU, but future epochs will take a significantly shorter time and learning will be finished in less than 10 mins.
Results
The model reaches a Root Mean Squared Error of 1.2 °C, while the R-squared is 0.79. Not bad huh, especially considering the model is only trained using images with no additional data.
Conclusion
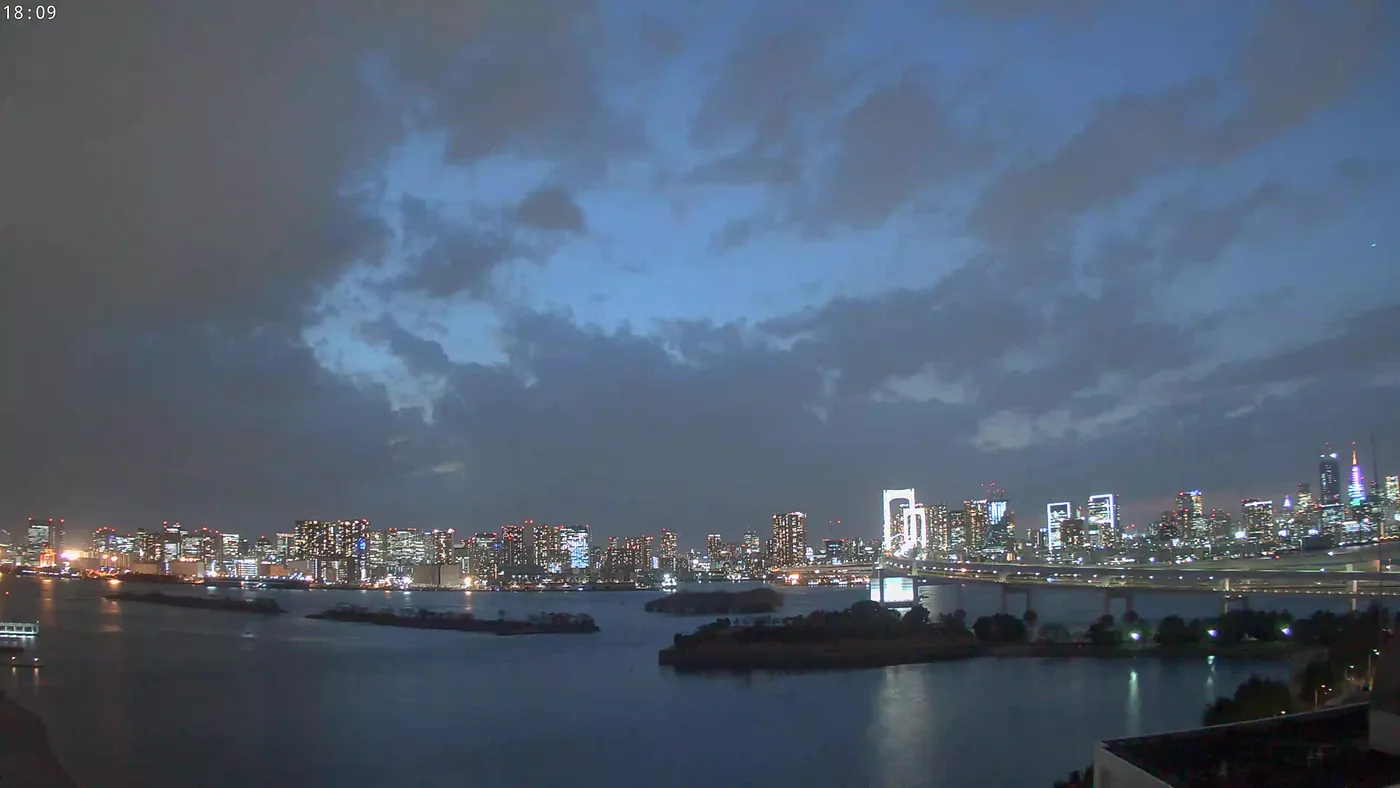
We trained a machine learning model using a convolutional neural network for predicting atmospheric temperature by looking at images of Rainbow Bridge, Tokyo. Image and temperature data were obtained from Youtube live cam and OpenWeatherMap over 2 days. 1,902 images were used for training the model and reasonable accuracy was achieved. The model struggles to predict the temperature at early morning hours and late afternoon hours where temperatures change drastically while images remain similar. This can be remedied by providing the hour as another variable to the model. Moreover, a highly accurate model can be trained with a larger dataset of images throughout a year.
Try it yourself!
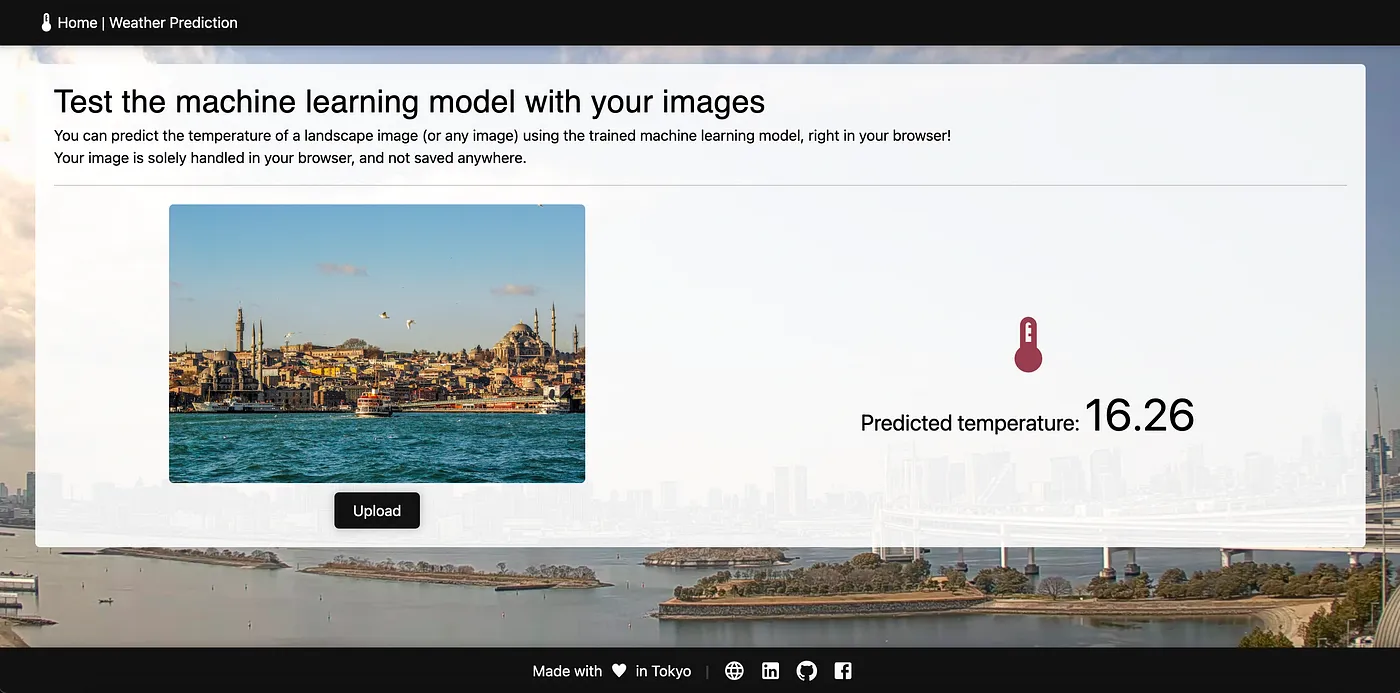
I have created a website that lets you predict the atmospheric temperature of a landscape image using your own images! The inference is done on the browser and the image is not saved anywhere.
Sources
Happy hacking!
Leave comment
Comments
There are no comments at the moment.
Check out other works

2024/06/03
Kango: Guess The Kanji

2024/07/24
Lingo: Guess The Word

2024/04/29
Druggio

2024/01/28
Tetris

2022/04/29
Moving Object Detection

2022/02/09
House Price Prediction

2021/12/01
Japan Drug Database

2021/09/20
Japanese Text Classification

2021/09/01
Travel Demand Prediction
