Convert ShapeFile To SVG With Python
Published: May 9, 2024
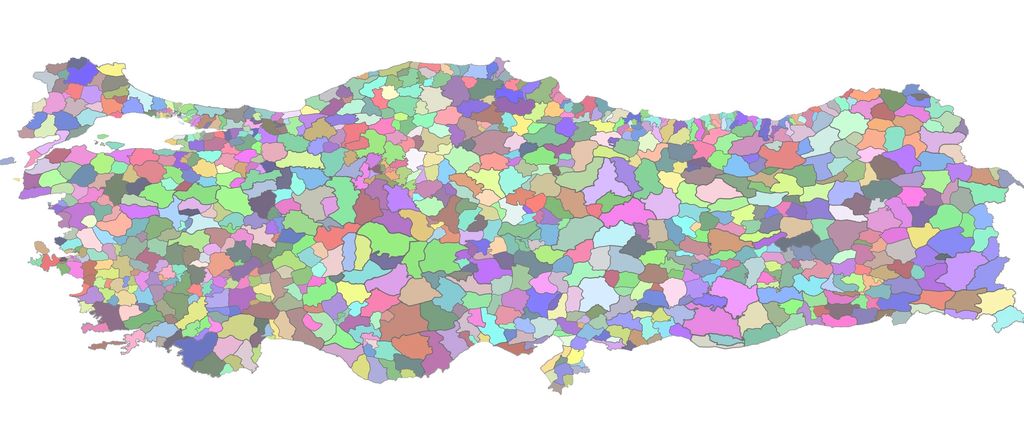
Background
SVGs are the backbone of the internet. They are especially useful when creating interative maps or infographics.
On the other hand, mapmakers work with data formats like ShapeFile and it is very difficult to embed these maps on the web.
For this, I have developed a script to convert a ShapeFile into SVG using Python.
Data
For this exercise, we are using the boundary map of Turkish districts. Districts are administrative entities in Turkey, and they come after provinces.The ShapeFile data is obtained from European Council's website.
The Code
## Import libraries
import geopandas as gpd
from bs4 import BeautifulSoup
import random
import textwrap

## Read data obtained from European Council as GeoPandas Dataframe
fp = "geodata/TR_2011_LAU1.shp"
data = gpd.read_file(fp)

## Define function that converts shapefile row to path
def process_to_svg_group(row):
	rd = row.to_dict()
	del rd["geometry"]

	# Keep dataframe columns as attributes of the path
	to_add = []
	for key, val in rd.items():
					to_add.append('data-{}="{}"'.format(key, val))

	# Convert geometry column to SVG paths
	ps = BeautifulSoup(row.geometry._repr_svg_(), "xml").find_all("path")
	paths = []
	for p in ps:
		new_path = f"""<g {' '.join(to_add)}>{str(p)}</g>"""
		paths.append(new_path)

	return "\n\n".join(paths)

## Convert each row of the dataframe to an SVG path
processed_rows = []
for i, row in data.sample(frac=1).iterrows():
	p = process_to_svg_group(row)
	processed_rows.append(p)

## Setup svg attributes
props = {
	"viewBox": f"{data.total_bounds[0]} {data.total_bounds[1]} {data.total_bounds[2] - data.total_bounds[0]} {data.total_bounds[3] -data.total_bounds[1] }",
	"xmlns": "http://www.w3.org/2000/svg",
	"xmlns:xlink": "http://www.w3.org/1999/xlink",
	"transform": "scale(1, -1)",
	"preserveAspectRatio":"XMinYMin meet"
}

## Add attributes
template = '{key:s}="{val:s}"'
attrs = " ".join([template.format(key=key, val=props[key]) for key in props])

## Create SVG
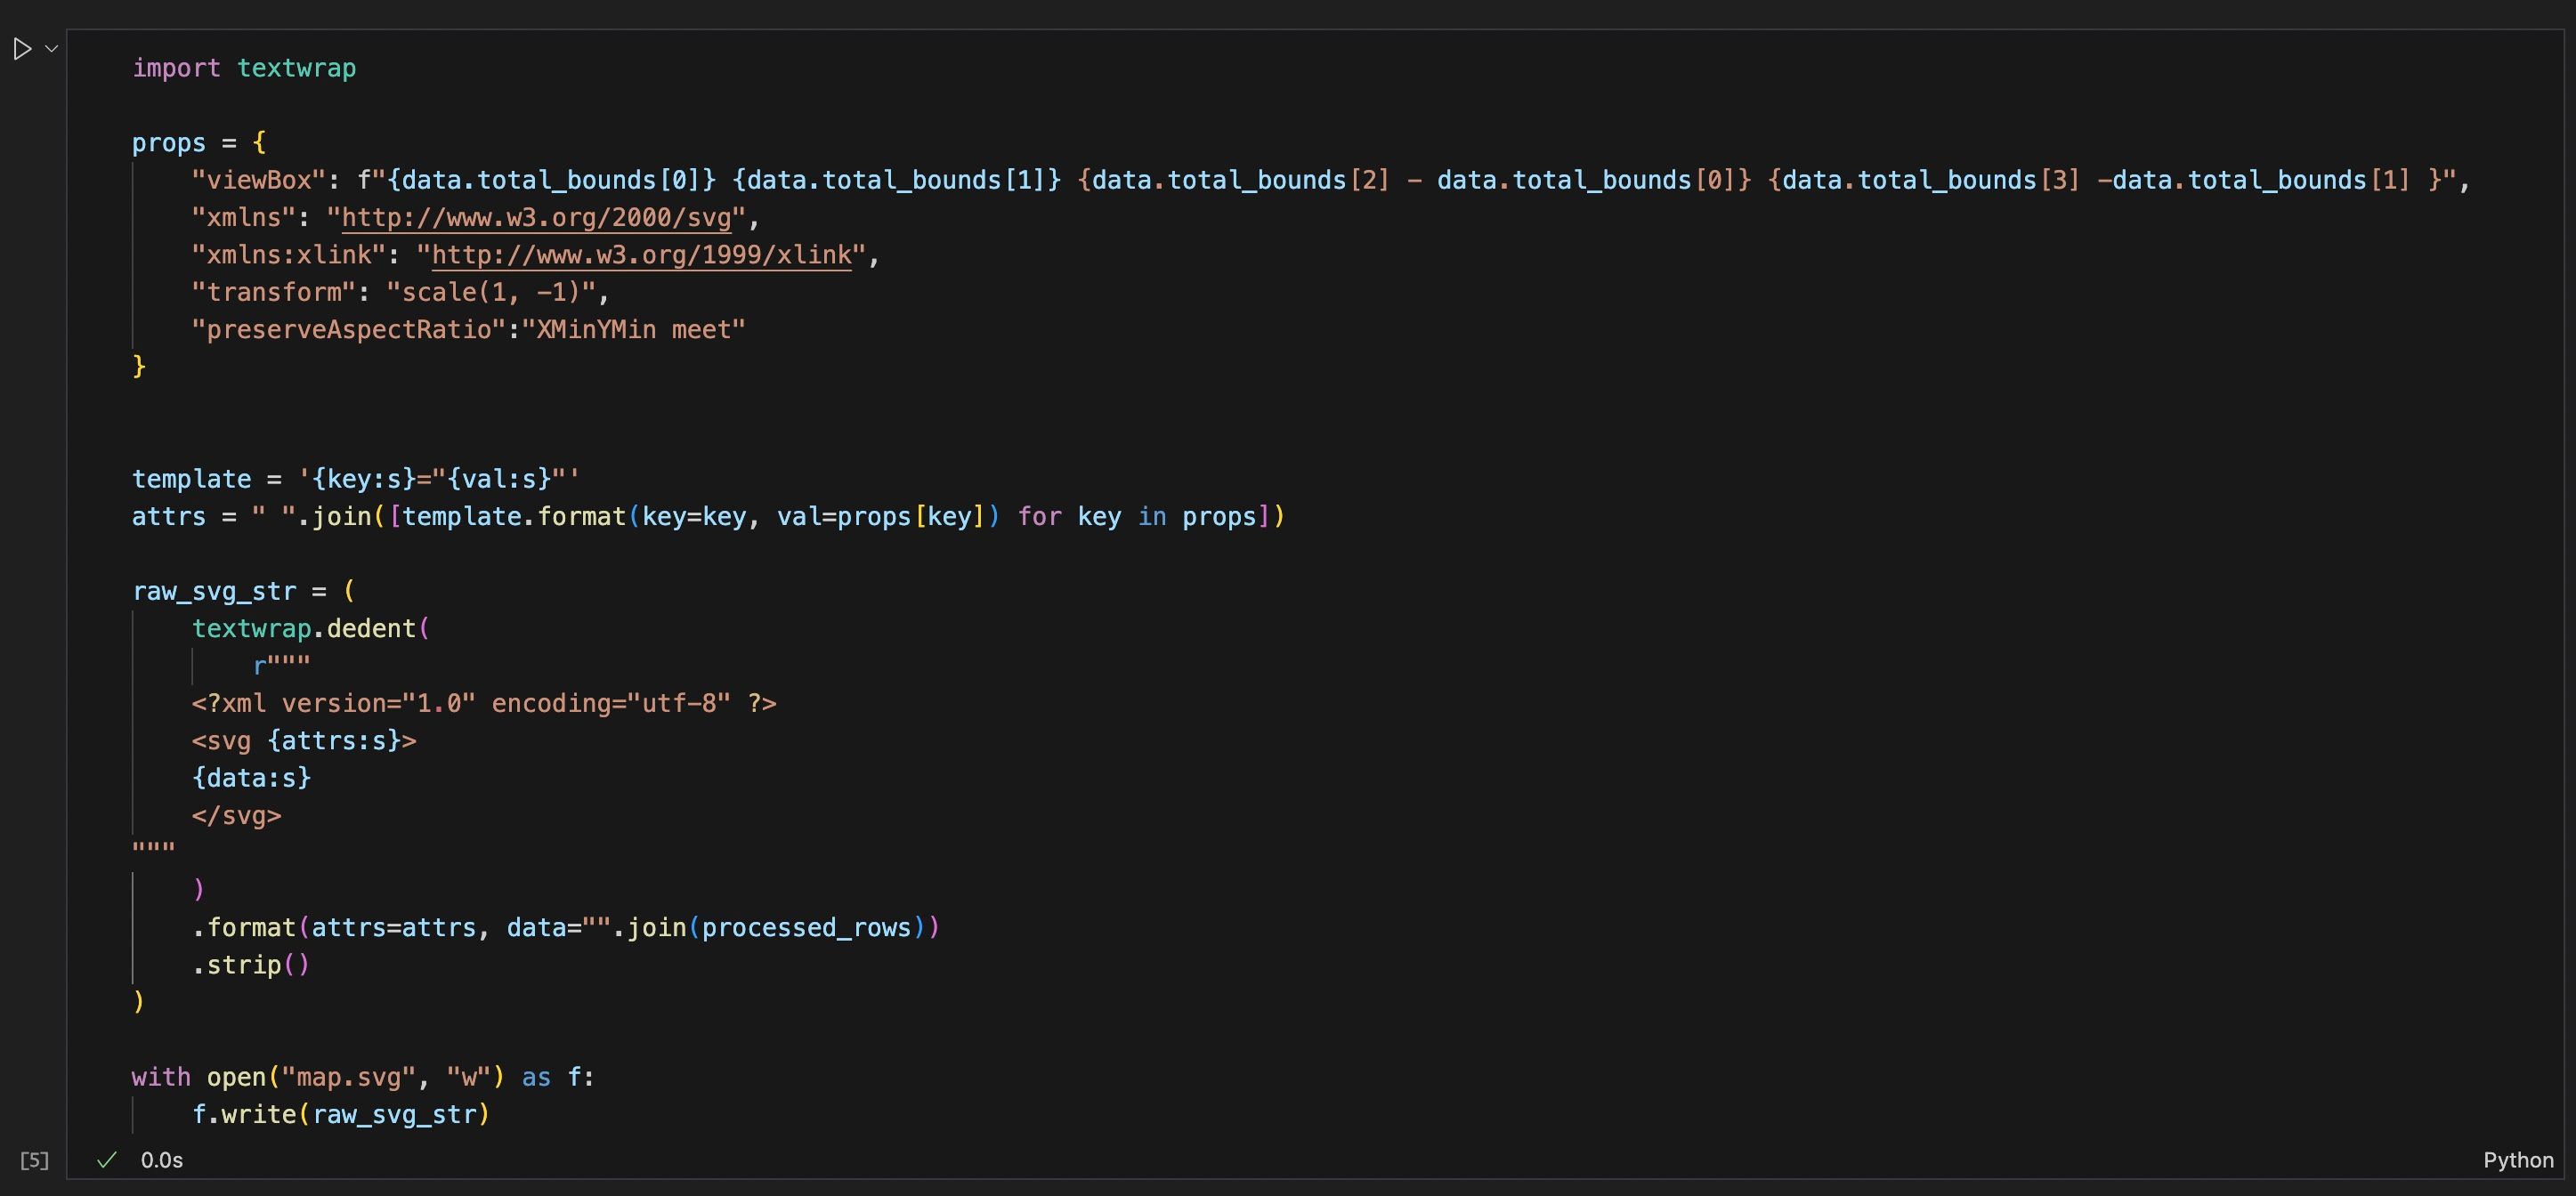
raw_svg_str = textwrap.dedent(r"""
	<?xml version="1.0" encoding="utf-8" ?>
	<svg {attrs:s}>
	{data:s}
	</svg>""").format(attrs=attrs, data="".join(processed_rows)).strip()

## Save SVG
with open("map.svg", "w") as f:
	f.write(raw_svg_str)
Please find the code in this this GitHub Repository.
Data Inspection
By using above code, we can start off with a ShapeFile data that looks like below:
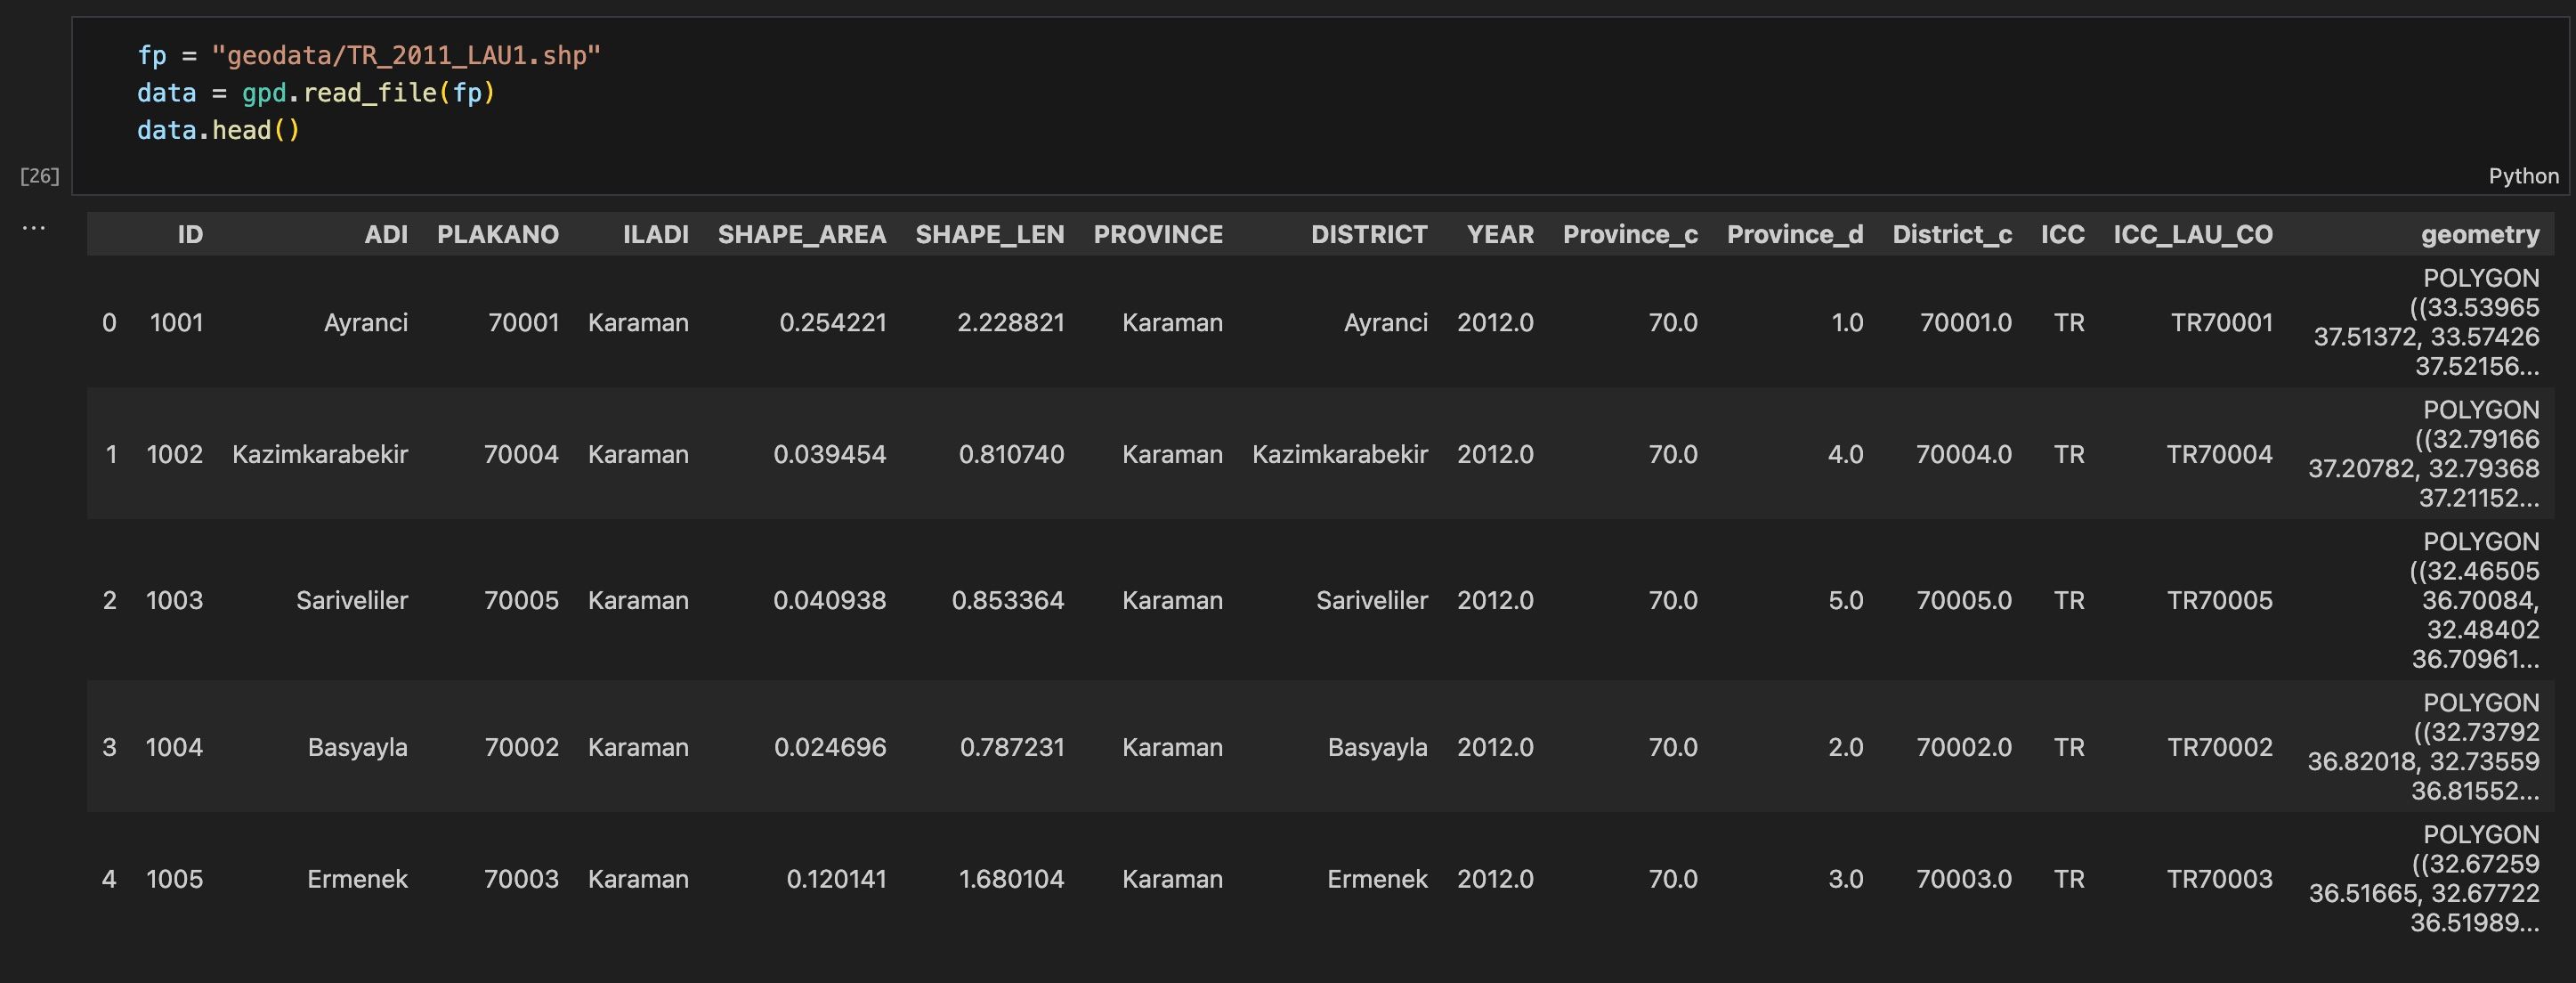
The most important column in the ShapeFile data is the last column called "geometry". This column will be used to draw the SVG.
However, other columns are contain important information, and we want to preserve them in the SVG, so we keep them as attirbutes in the SVG.
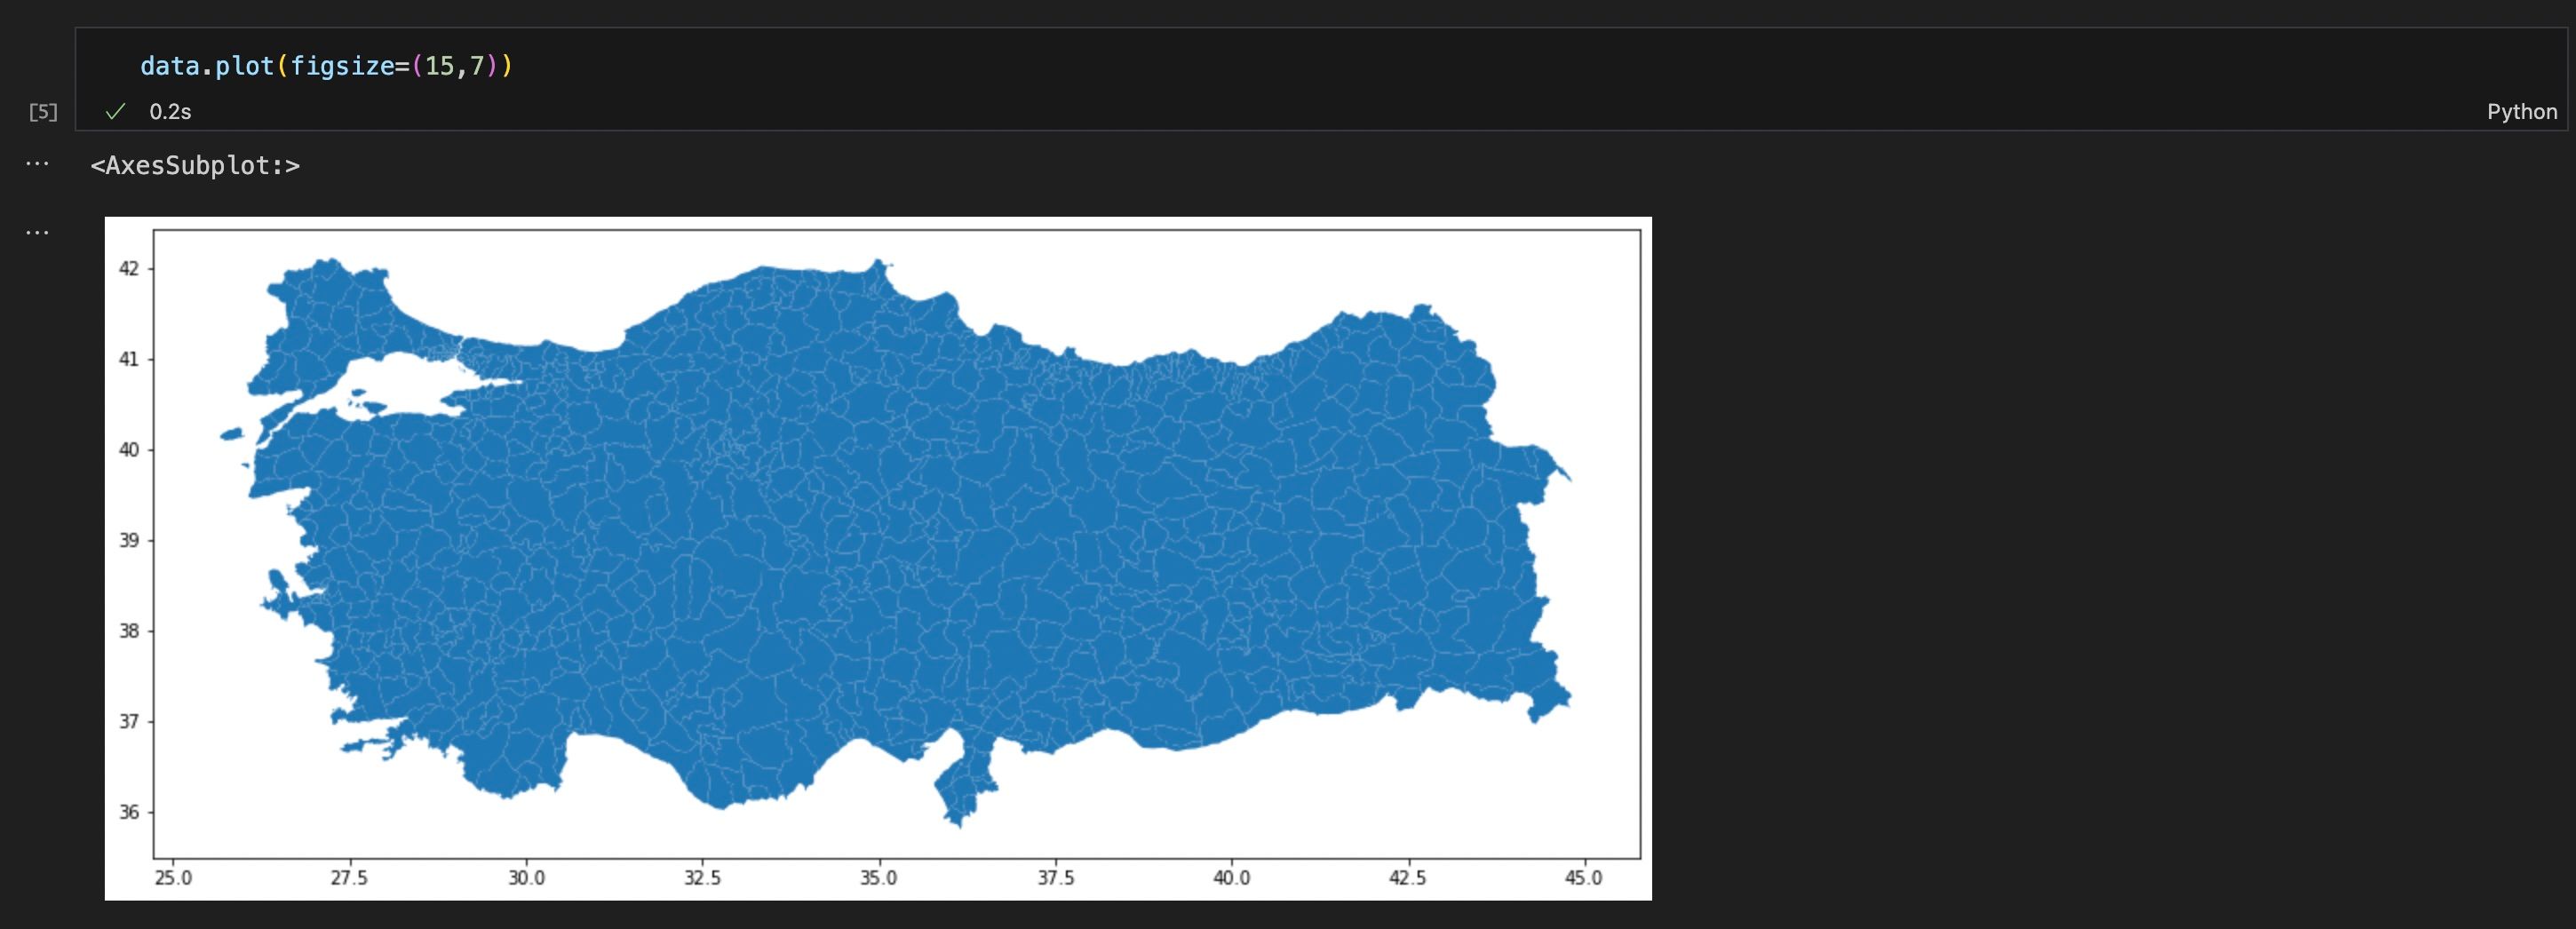
The ShapeFile data can be plotted easily using the geopandas library:
Data Processing
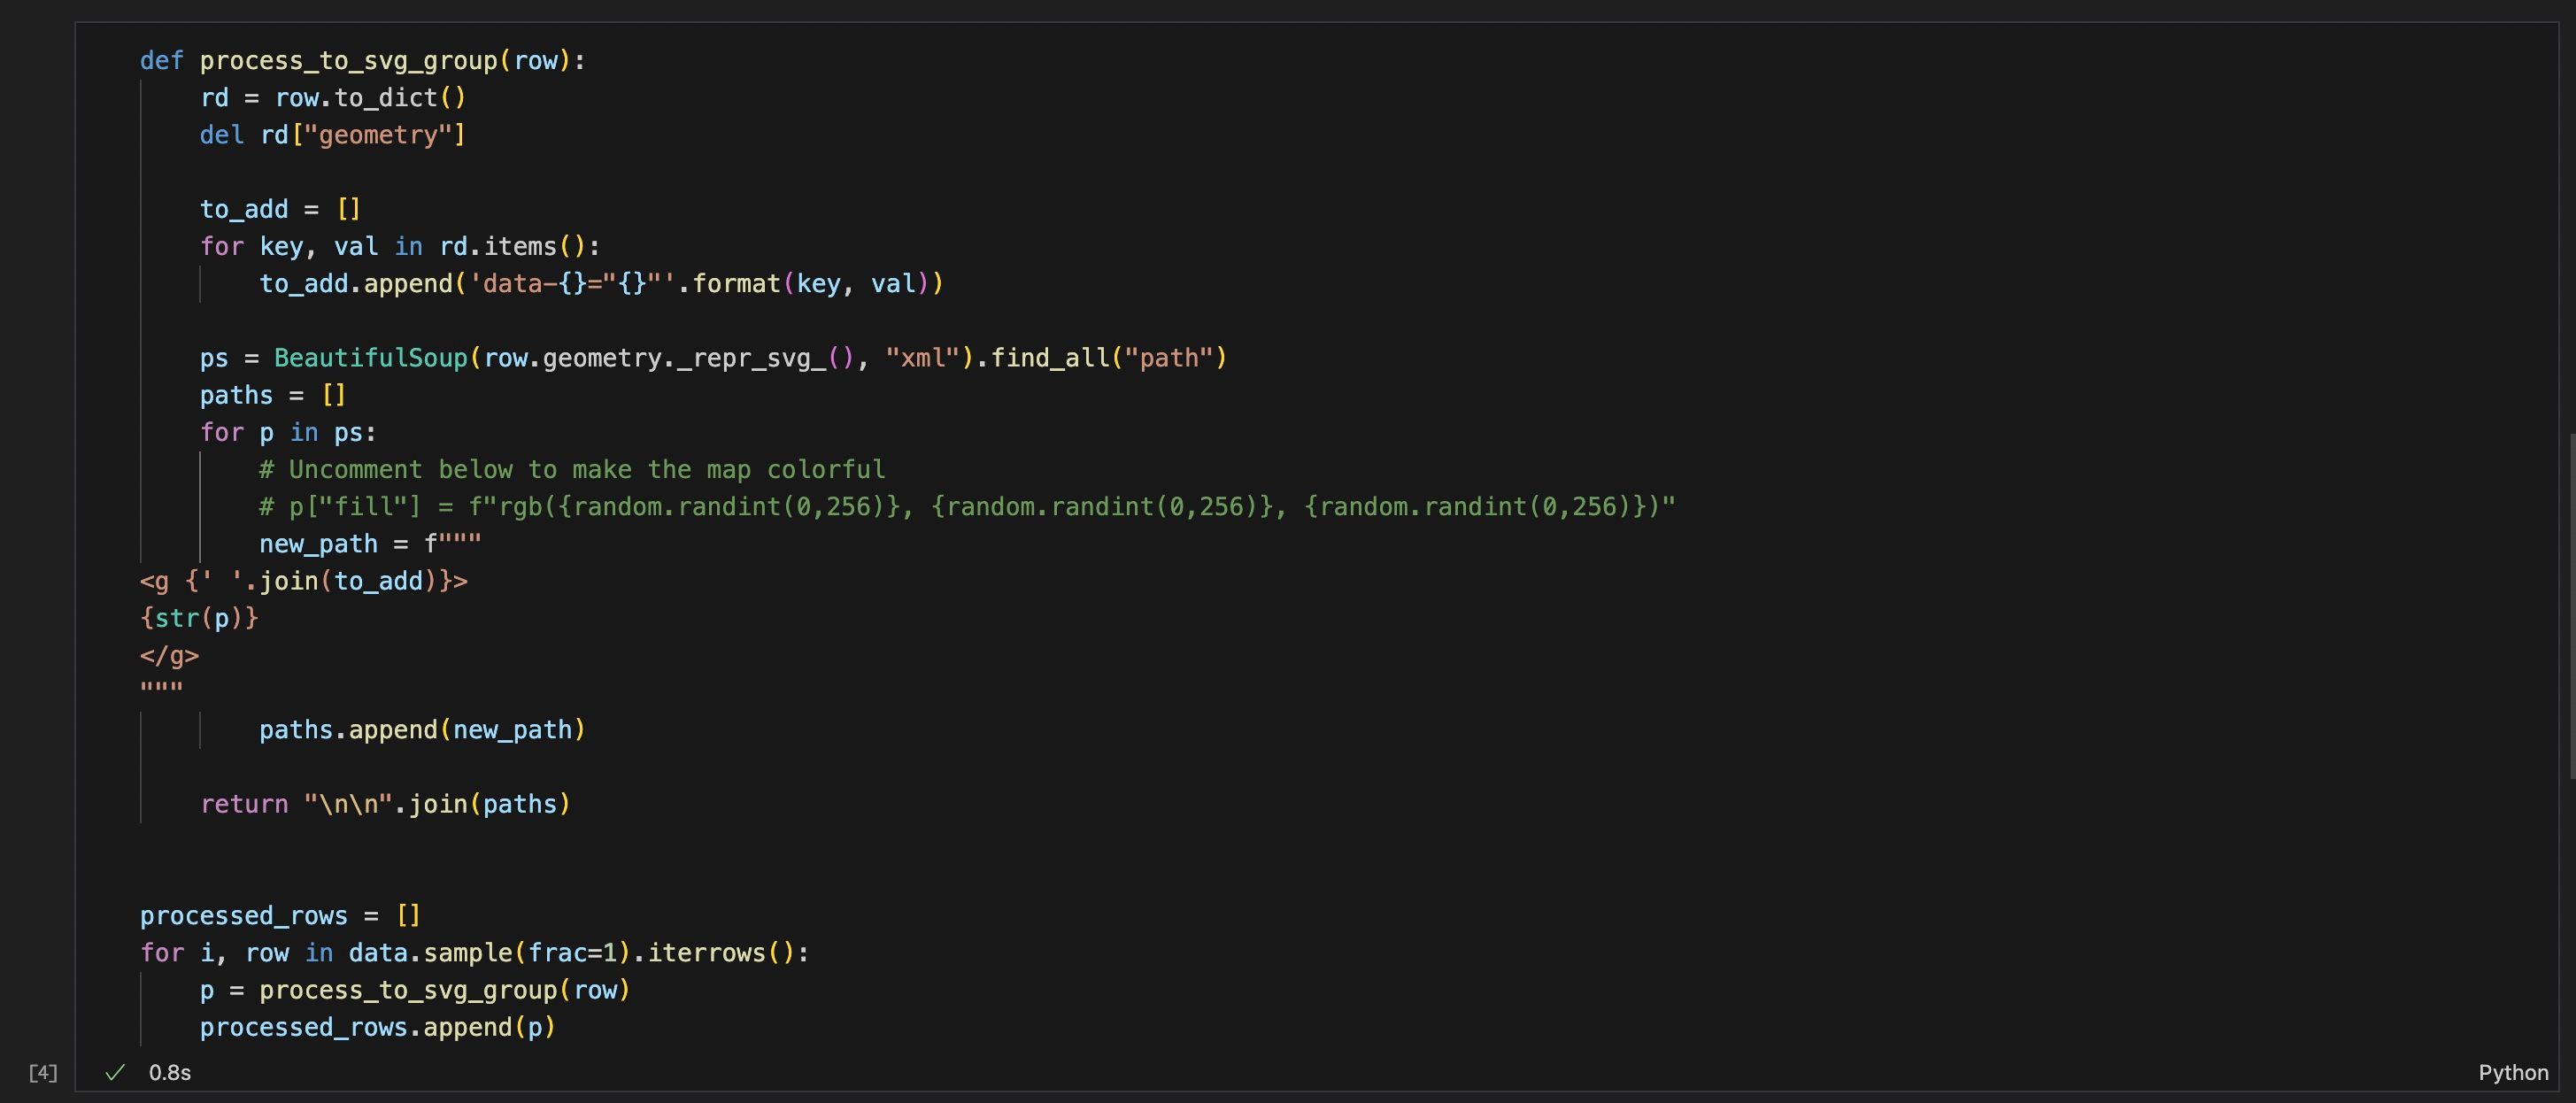
Below code loops through each row, converts geometry column to an SVG path, and adds the info in other columns as attributes to the path.
Final touches
When the paths are created, we only need to merge them into an SVG, and add the necessary attributes to the SVG tag.
Once the processing is complete, we finally save the SVG, which can be viewed in the browser.
Resources
Here is the this GitHub Repository that has the data, code, and resulting svg and some images.
Let me know in case of any questions.
Happy hacking!
Leave comment
Comments
There are no comments at the moment.
Check out other blog posts

2025/07/07
Q-Learning: Interactive Reinforcement Learning Foundation

2025/07/06
Optimization Algorithms: SGD, Momentum, and Adam

2025/07/05
Building a Japanese BPE Tokenizer: From Characters to Subwords

2024/06/19
Create A Simple and Dynamic Tooltip With Svelte and JavaScript
2024/06/17
Create an Interactive Map of Tokyo with JavaScript

2024/06/14
How to Easily Fix Japanese Character Issue in Matplotlib

2024/06/13
Book Review | Talking to Strangers: What We Should Know about the People We Don't Know by Malcolm Gladwell

2024/06/07
Most Commonly Used 3,000 Kanjis in Japanese

2024/06/07
Replace With Regex Using VSCode

2024/06/06
Do Not Use Readable Store in Svelte

2024/06/05
Increase Website Load Speed by Compressing Data with Gzip and Pako

2024/05/31
Find the Word the Mouse is Pointing to on a Webpage with JavaScript

2024/05/29
Create an Interactive Map with Svelte using SVG

2024/05/28
Book Review | Originals: How Non-Conformists Move the World by Adam Grant & Sheryl Sandberg

2024/05/27
How to Algorithmically Solve Sudoku Using Javascript

2024/05/26
How I Increased Traffic to my Website by 10x in a Month

2024/05/24
Life is Like Cycling
2024/05/19
Generate a Complete Sudoku Grid with Backtracking Algorithm in JavaScript

2024/05/16
Why Tailwind is Amazing and How It Makes Web Dev a Breeze

2024/05/15
Generate Sitemap Automatically with Git Hooks Using Python

2024/05/14
Book Review | Range: Why Generalists Triumph in a Specialized World by David Epstein

2024/05/13
What is Svelte and SvelteKit?

2024/05/12
Internationalization with SvelteKit (Multiple Language Support)

2024/05/11
Reduce Svelte Deploy Time With Caching

2024/05/10
Lazy Load Content With Svelte and Intersection Oberver

2024/05/10
Find the Optimal Stock Portfolio with a Genetic Algorithm
2024/05/08
Reactivity In Svelte: Variables, Binding, and Key Function

2024/05/07
Book Review | The Art Of War by Sun Tzu

2024/05/06
Specialists Are Dead. Long Live Generalists!

2024/05/03
Analyze Voter Behavior in Turkish Elections with Python
2024/05/01
Create Turkish Voter Profile Database With Web Scraping

2024/04/30
Make Infinite Scroll With Svelte and Tailwind

2024/04/29
How I Reached Japanese Proficiency In Under A Year

2024/04/25
Use-ready Website Template With Svelte and Tailwind

2024/01/29
Lazy Engineers Make Lousy Products

2024/01/28
On Greatness

2024/01/28
Converting PDF to PNG on a MacBook

2023/12/31
Recapping 2023: Compilation of 24 books read

2023/12/30
Create a Photo Collage with Python PIL

2024/01/09
Detect Device & Browser of Visitors to Your Website

2024/01/19
Anatomy of a ChatGPT Response
