Create an Interactive Map of Tokyo with JavaScript
Published: June 17, 2024
Background
Most apps nowadays have interactive SVG maps which let you interact with elements in the map by either clicking or hovering on them.
It's crucial to know how to build such an interactive map with simple tools such as SVG and JavaScript in order to be a fully-fledged web developer.
Objective
In this blog, we will use an SVG map of Tokyo where some information will be displayed when you hover over a municipality in the city.
You can apply the code developed in this code to any kind of SVG map. It doesn't have to be Tokyo at all.
I have chosen Tokyo beacuse I was able to find its municipal SVG map, as well some random data that I could display when you hover over the municipality.
I will be mainly using JavaScript and a little bit of Svelte in this code. Svelte is chosen for ease of use, but its syntax can be easily changed back to plain vanilla JavaScript.
No libraries are imported for the tooltip function we use to display info when a municipality is hovered.
Method
SVG File
We start with a SVG map of Tokyo. Here is the map I have created using various sources on the internet. It's a no-fills svg file that is only 13 KB. It provides the geometry of municipalities as well as its name and municipality code:
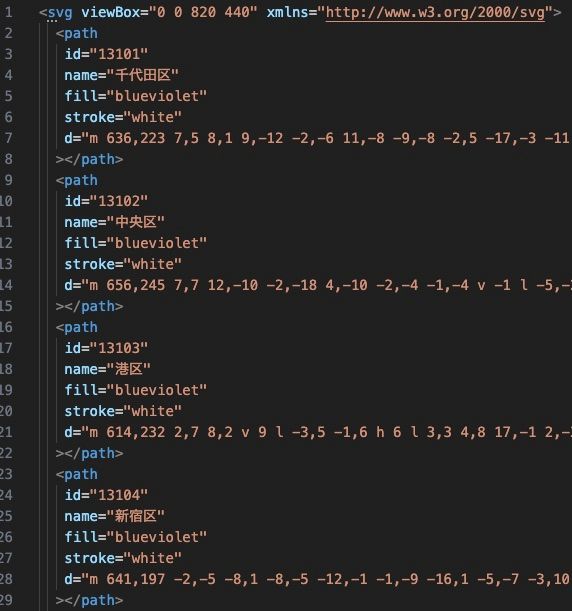
Below you can see the actual SVG.
The 23 special wards are colored in blueviolet while other municipalities are colored in steelblue My 2 favorite colors :)
Having name and code assigned to each municipality allows us to identify whicih municipality mouse is hovered over.
You can find the SVG file here.
Supplemental Data
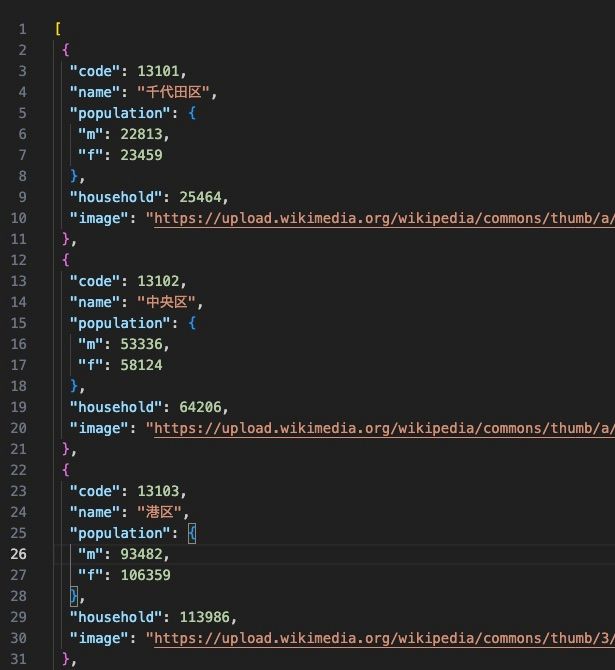
Now that we have the SVG file, we need some data to show when the user hovers over the municipality. For this, I have used the population and household data provided by the Bureau of Statistics. The data looks like this:

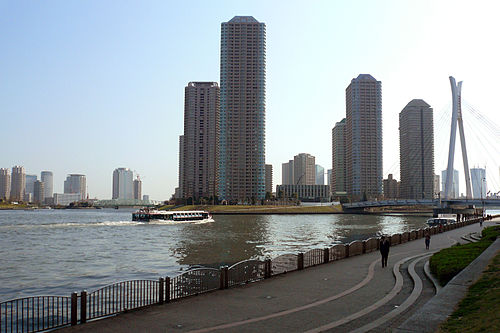
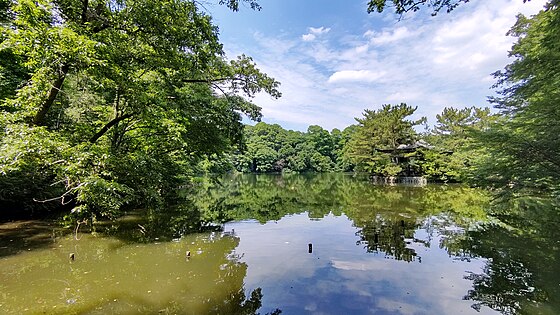
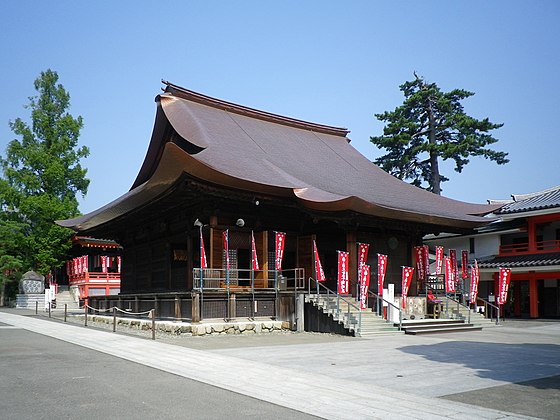
Showing only numbers is boring. So I decided to spice up things by adding a picture to each municipality. The pictures are fetched from Wikipedia (Scroll to see all).
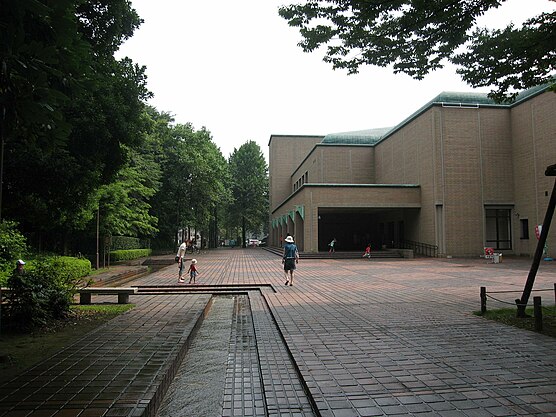
千代田区

中央区
港区

新宿区

文京区

台東区

墨田区

江東区

品川区

目黒区

大田区

世田谷区

渋谷区

中野区

杉並区

豊島区

北区

荒川区

板橋区

練馬区
足立区

葛飾区

江戸川区

八王子市

立川市

武蔵野市

三鷹市

青梅市

府中市

昭島市

調布市

町田市
小金井市

小平市

日野市
東村山市

国分寺市

国立市

福生市

狛江市

東大和市
清瀬市

東久留米市

武蔵村山市
多摩市

稲城市

羽村市

あきる野市

西東京市

西多摩郡瑞穂町

西多摩郡日の出町

西多摩郡檜原村

西多摩郡奥多摩町

大島町
利島村
新島村

神津島村

三宅島三宅村
御蔵島村

八丈島八丈町

青ヶ島村

小笠原村

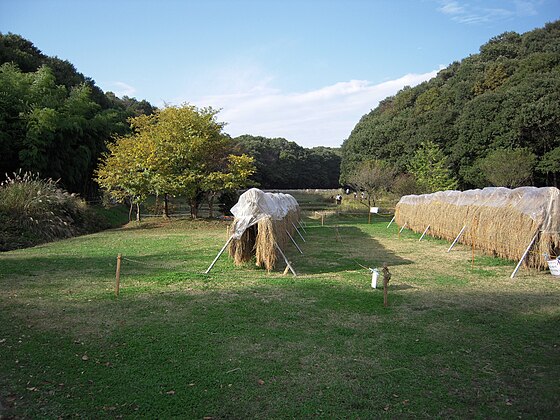
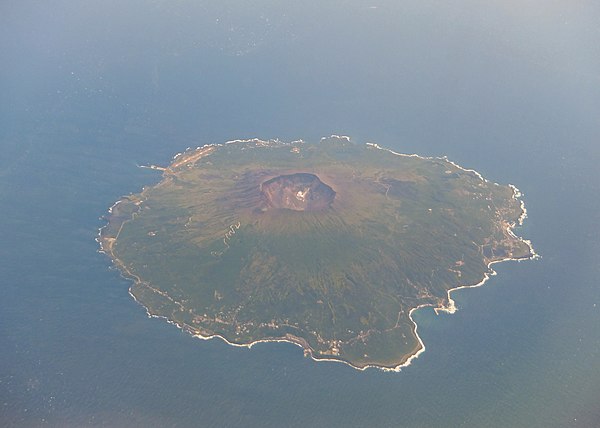
I really like this view of pictures because as you scroll down you can see how Tokyo progressively moves from urban to rural and finally to islands.
It is refreshing to know that Tokyo is not just made up of 23 highly urban wards.
We mix the population data with pictures and we have a final JSON file that looks like this.
Front End - SVG
Now that we have the SVG map where each path denotes a municipality. Let's add a function so that when the path is hovered, it will trigger a function:
<script>
let data = [
	{
		code: 13102,
		name: '中央区',
		population: { m: 53336, f: 58124 },
		household: 64206,
		image: 'https://upload.wikimedia...'
	}, // ...
]

function handleMouseover(key) {
	// Get the municipality that is hovered
	entity = data.filter((d) => d.code === key)[0];
}
</script>

<svg>
	<path
		on:mouseover={() => handleMouseover(13102)}
		d="m 636,223 7,5 8,1 9,-12 -2,-6 11,-8 -9,-8 -2,5 -17,-3 -11,13 v 7 z"
	/>
	<!-- ... -->
</svg>
Above function is attached to every path in the SVG file. With this, we can now keep tabs on which municipality the user is hovering on.
Front End - Info Panel
Now let's create an info panel that shows the info about that municipality that the user is hovering on.
I recommed using Tailwind as it makes styling really easy. Read my article about it here.
Below is the code we use for creating the info panel:
<div class="flex rounded-xl overflow-hidden shadow-xl mx-auto my-8">
<img
class="h-100 w-[150px] min-w-[150px] max-w-[150px] object-cover"
src="https://upload.wikimedia..."
alt="中央区"
/>
<div class="px-8 py-4 flex gap-2 flex-col bg-white">
<p class="text-3xl font-bold text-center">中央区</p>
<div>
<p class="text-xs text-slate-500 font-bold text-center">Population</p>
<p class="text-xl text-center">111,460</p>
</div>
<div>
<p class="text-xs text-slate-500 font-bold text-center"># Households</p>
<p class="text-xl text-center">64,206</p>
</div>
</div>
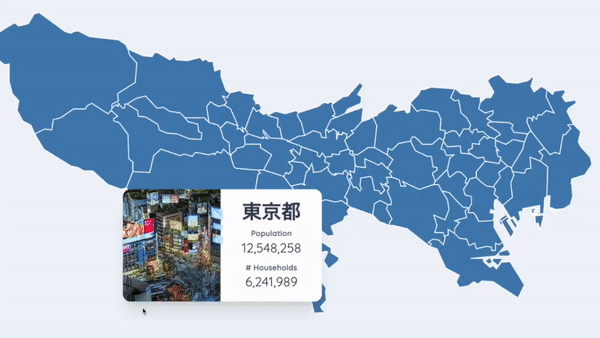
</div>This code produces below nice-looking panel. This is what we are going to show when a municipality is hovered.
中央区
Population
111,460
# Households
64,206
Front End - Tooltip
Now that we have SVG and info panel ready, the only thing remaining is to show the info panel when a municipality is hovered on.
We also want to do this next to the mouse, in a "Tooltip" fashion.
Below code is used to implement Tooltip using vanilla JavaScript. The good thing about this code is that, we divide the screen into 4 quadrants, and depending on the quadrant where there mouse is, we calculate the position of tooltip.
This is to make sure that tooltip does not bleed over the screen. For example., if mouse is too close to the bottom, the tooltip will appear above the mouse. On the other hand, if it's too close to the top, the tooltip will appear below the mouse.
I will write a separate blogpost for this implementation so if you are interested, feel free to check my blogs later.
<script>
function handleMouseMove(event) {
	let x = event.clientX;
	let y = event.clientY;
	let rect = container.getBoundingClientRect();

	info.style.top = y < innerHeight / 2 ? y - rect.top + 10 + 'px' : '';
	info.style.bottom = y < innerHeight / 2 ? '' : rect.bottom - y + 10 + 'px';

	info.style.left = x < innerWidth / 2 ? x - rect.left + 10 + 'px' : '';
	info.style.right = x < innerWidth / 2 ? '' : rect.right - x + 10 + 'px';
}
</script>

<svelte:window
	bind:innerWidth
	bind:innerHeight
	on:mousemove={(e) => handleMouseMove(e)}
/>
Result
Now that we have implemented all the necessary steps, we can take a look at our creation.
Hover over below SVG to see an image of it, its population and # households:

Looks pretty with the sleek info panel and the tooltip, doesn't it?
Conclusion
In this blogpost, we have developed an interactive map for showing some demographic data using Svelte, SVG, JavaScript, and Tailwind.
In order to achieve this, we have created an SVG file of Tokyo, collected relevant info such as population and image, and finally developed front-end elements like tooltip and info panel.
This kind of functionality is commonly used in dashboards so it is good to know how to implement it for a front-end/ full stack engineer.
Any questions? Let me know below.
Until the next blog, happy hacking!
Leave comment
Comments
Check out other blog posts

2026/03/24
My Claude Code Settings: Maximum Output Without Babysitting

2025/07/07
Q-Learning: Interactive Reinforcement Learning Foundation

2025/07/06
Optimization Algorithms: SGD, Momentum, and Adam

2025/07/05
Building a Japanese BPE Tokenizer: From Characters to Subwords

2024/06/19
Create A Simple and Dynamic Tooltip With Svelte and JavaScript

2024/06/14
How to Easily Fix Japanese Character Issue in Matplotlib

2024/06/13
Book Review | Talking to Strangers: What We Should Know about the People We Don't Know by Malcolm Gladwell

2024/06/07
Most Commonly Used 3,000 Kanjis in Japanese

2024/06/07
Replace With Regex Using VSCode

2024/06/06
Do Not Use Readable Store in Svelte

2024/06/05
Increase Website Load Speed by Compressing Data with Gzip and Pako

2024/05/31
Find the Word the Mouse is Pointing to on a Webpage with JavaScript

2024/05/29
Create an Interactive Map with Svelte using SVG

2024/05/28
Book Review | Originals: How Non-Conformists Move the World by Adam Grant & Sheryl Sandberg

2024/05/27
How to Algorithmically Solve Sudoku Using Javascript

2024/05/26
How I Increased Traffic to my Website by 10x in a Month

2024/05/24
Life is Like Cycling
2024/05/19
Generate a Complete Sudoku Grid with Backtracking Algorithm in JavaScript

2024/05/16
Why Tailwind is Amazing and How It Makes Web Dev a Breeze

2024/05/15
Generate Sitemap Automatically with Git Hooks Using Python

2024/05/14
Book Review | Range: Why Generalists Triumph in a Specialized World by David Epstein

2024/05/13
What is Svelte and SvelteKit?

2024/05/12
Internationalization with SvelteKit (Multiple Language Support)

2024/05/11
Reduce Svelte Deploy Time With Caching

2024/05/10
Lazy Load Content With Svelte and Intersection Oberver

2024/05/10
Find the Optimal Stock Portfolio with a Genetic Algorithm

2024/05/09
Convert ShapeFile To SVG With Python

2024/05/08
Reactivity In Svelte: Variables, Binding, and Key Function

2024/05/07
Book Review | The Art Of War by Sun Tzu

2024/05/06
Specialists Are Dead. Long Live Generalists!

2024/05/03
Analyze Voter Behavior in Turkish Elections with Python

2024/05/01
Create Turkish Voter Profile Database With Web Scraping

2024/04/30
Make Infinite Scroll With Svelte and Tailwind

2024/04/29
How I Reached Japanese Proficiency In Under A Year

2024/04/25
Use-ready Website Template With Svelte and Tailwind

2024/01/29
Lazy Engineers Make Lousy Products

2024/01/28
On Greatness
2024/01/28
Converting PDF to PNG on a MacBook

2023/12/31
Recapping 2023: Compilation of 24 books read

2023/12/30
Create a Photo Collage with Python PIL

2024/01/09
Detect Device & Browser of Visitors to Your Website

2024/01/19
Anatomy of a ChatGPT Response