Create Turkish Voter Profile Database With Web Scraping
Published: May 1, 2024
Some of you may know that there were local elections on 31 March 2024 in Turkey. These elections caused repurcussions around the world as 22-year AKP regime got its first defeat in an election. Elections' surprise winner was CHP and they now govern cities which make up 60% of the population and 80% of the economic output of the country.
So how did this happen?
Background
If you watch Turkish TVs, pundits blame this defeat on the unsatisified retired population of the country due to economic reasons.
Another common perception in Turkey is that country's youth support (at 70% levels!) CHP policies, while AKP lacks support from the youth. So it is said that CHP's support is only going to increase going forward.
Pundits are known to make false predictions and give incorrect information. As a data scientist, it is my pleasure and duty to check whether these claims are true using data.
Data
To do such analysis, we need age profile of voters and how they vote. People usually conduct costly surveys for this purpose. However, we have a nice publicly available data that we can use.
Turkish Statistical Institute (TUIK) publishes the election results data as well as the voter age/ sex/ education profile at a district level. The 81 provinces of Turkey are divided into 973 districts.
For our purpose, we only need to look at age data, as we can represent youth as voters below the age ~30 and retired people as those above the age of 65, as the age of retirement is 65 in Turkey.
We can get this data by looking at TUIK's election database. The latest available data is unfortunately 2018 database. A lot has changed since 2018 but this data can give us a glimpse of macro voter trends.
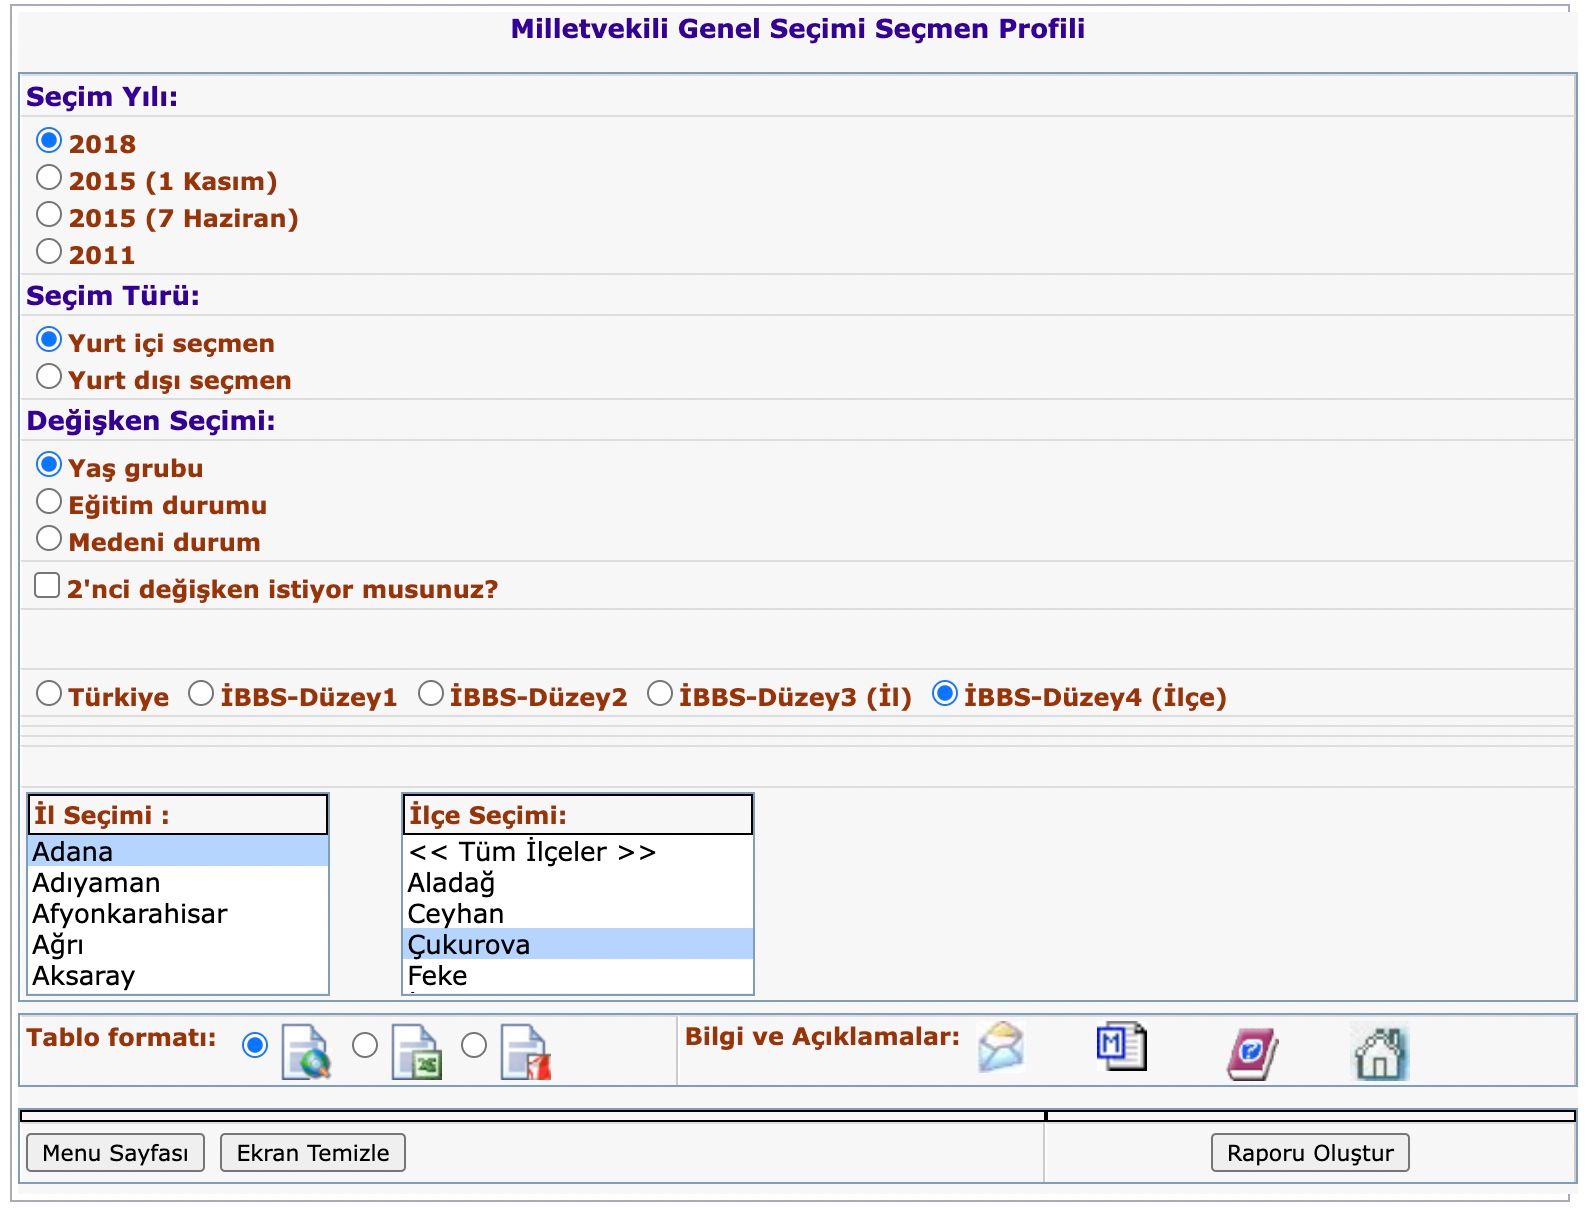
The issue with this database is that, we need to create individual report for each district. District level report looks like below:
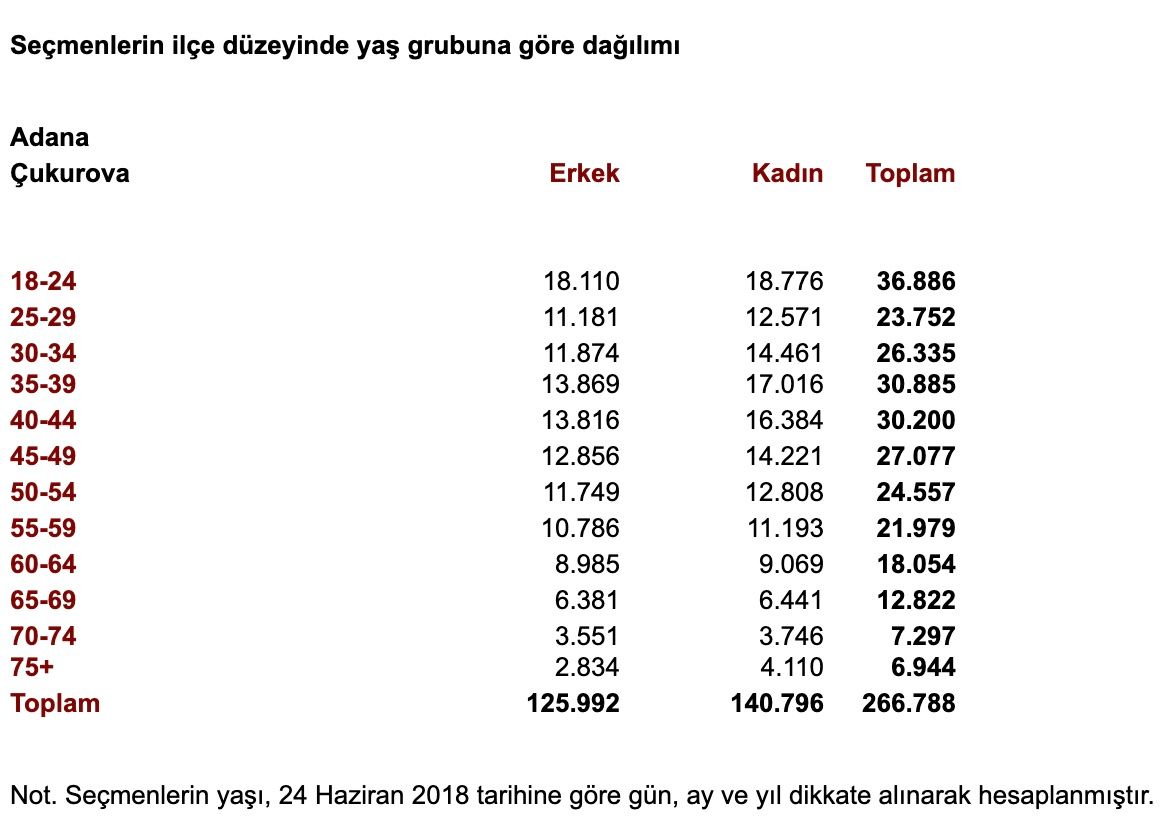
Considering that there are 973 districts, this is both boring and tiring, and this is where scraping comes into picture.
Scraping the data
Considering that there are 973 districts, this is both boring and tiring, and this is where scraping comes into picture.
Please take a look at this GitHub repo for all the code needed to scrape the data, collate it into a dataframe, and the resulting CSV file.
Overall, the idea is to loop through all districts by switching between cities and districts using Selenium and clicking on "Download the report". Once the report is downloaded, we move to the next district. When all districts of a city are exhausted, we move to the next city. This way, we loop through 81 cities and 937 districts of Turkey and download a report for each district.
from selenium import webdriver
import chromedriver_autoinstaller
from selenium.webdriver.common.by import By
import time
chromedriver_autoinstaller.install()

###### Start webdriver
driver = webdriver.Chrome()
time.sleep(1)

###### Go to the main site
driver.get("https://biruni.tuik.gov.tr/secimdagitimapp/secimsecmen.zul")
time.sleep(1)

###### Select radio buttons for the desired areas
for span in driver.find_elements(By.CSS_SELECTOR, ".grid-od span"):
    if span.text == "2018":
        span.find_element(By.CSS_SELECTOR, "input").click()
        time.sleep(1)


for span in driver.find_elements(By.CSS_SELECTOR, ".grid-od span"):
    if span.text == "Yurt içi seçmen":
        span.find_element(By.CSS_SELECTOR, "input").click()
        time.sleep(1)

for span in driver.find_elements(By.CSS_SELECTOR, ".grid-od span"):
    if span.text == "Yaş grubu":
        span.find_element(By.CSS_SELECTOR, "input").click()
        time.sleep(1)

for span in driver.find_elements(By.CSS_SELECTOR, ".grid .gc span"):
    if span.text == "İBBS-Düzey4 (İlçe)":
        span.find_element(By.CSS_SELECTOR, "input").click()
        time.sleep(1)

###### Identify the cities in city (There should be 81)
tables = driver.find_elements(By.CSS_SELECTOR, ".listbox-btable")

for table in tables:
    if "Adana" in table.text:
        cities = table.find_elements(By.CSS_SELECTOR, "td")
        break

city_names = [city.text for city in cities]

###### Save data per district
for city in cities:
    city.click()
    time.sleep(2)

    tables = driver.find_elements(By.CSS_SELECTOR, ".listbox-btable")

    for table in tables:
        if "Tüm İlçeler" in table.text:
            districts = table.find_elements(By.CSS_SELECTOR, "td")
            break

    district_names = [district.text for district in districts]
    districts = [district for district in districts if "Tüm İlçeler" not in district.text]

    for district in districts:
        district.click()
        time.sleep(1)

        # Set Excel
        excel =  driver.find_element(By.CSS_SELECTOR, 'span[title="EXCEL"]').find_element(By.CSS_SELECTOR, 'input').click()
        time.sleep(1)

        ## Save data
        save =  driver.find_element(By.CSS_SELECTOR, 'input[value="Raporu Oluştur"]').click()

        ## Log, Sleep
        print(city.text, district.text)
        time.sleep(1)
Aggregating the data
Once the data is collected, we will have 937 HTML files waiting to be processed. Using below code, we clean up and aggregate the data into one big CSV file:
import pandas as pd
import os
from bs4 import BeautifulSoup
import warnings
warnings.simplefilter(action='ignore')

folder = "<Address/with/downloaded/files/from/TUIK>"

paths = [f for f in os.listdir(folder) if f.endswith("xls")]
dfs = []

for path in paths:
    with open(f"{folder}/{path}", "r", encoding="iso-8859-9") as f:
        text = f.read()
        soup = BeautifulSoup(text, "html")
        tables = pd.read_html(str(soup.findAll("table")[1]))
        city = tables[0].iloc[0, 0]
        df = tables[2]
        df.drop(1, axis=1, inplace=True)
        district = df.iloc[0, 0]
        df.columns = ["age", "male", "female", "all"]
        df["city"] = city
        df["district"] = district
        df = df[1:]
        for col in df.columns:
            df[col] = df[col].str.replace(".", "", regex=False)
        df = df[df["age"] != "Toplam"]
        df["male"] = pd.to_numeric(df["male"])
        df["female"] = pd.to_numeric(df["female"])
        df["all"] = pd.to_numeric(df["all"])

        dfs.append(df)

df = pd.concat(dfs, axis=0, ignore_index=True)
df.to_csv("data.csv", index=False)
Result
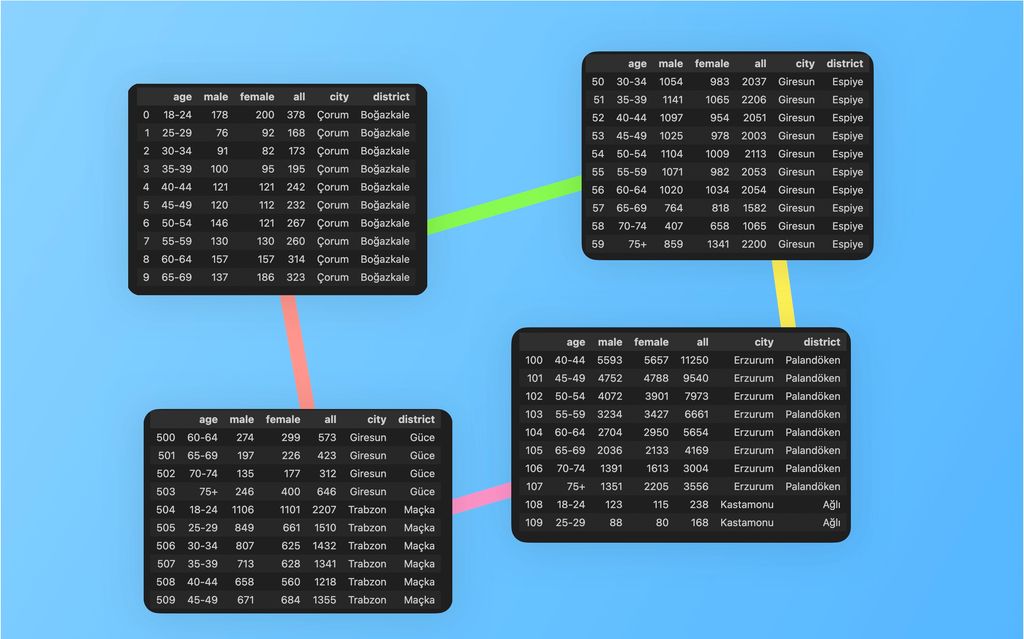
The resulting file looks like below with the voter age data at the district level for 2018 general elections in Turkey: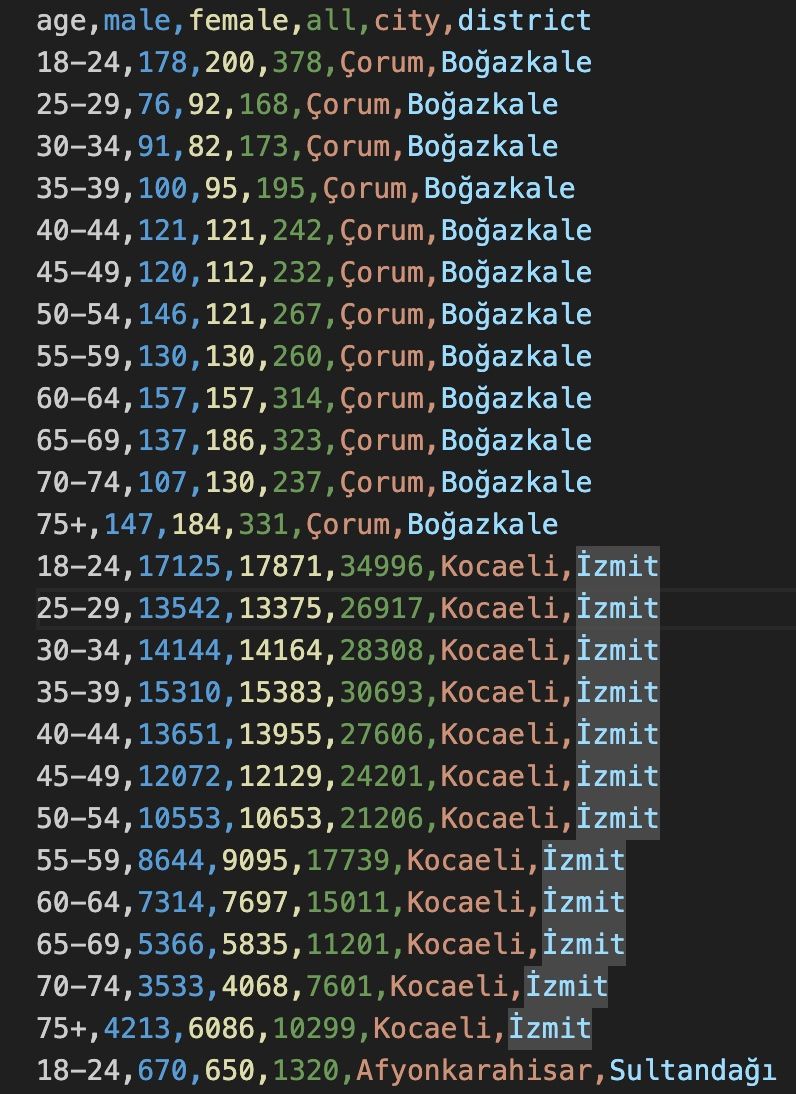
Conclusion
With this data, we can now run models like regression and see how the votre age profile is influincing the voting results. Each district will be treated as a data point, and with 937 data points, we should be able to get statistically significant results. But this is for another article.
Hope this data is used by many people to develope useful models for Turkish elections.
Check out the GitHub repo for the code and the data.
Happy hacking!
Leave comment
Comments
There are no comments at the moment.
Check out other blog posts

2025/07/07
Q-Learning: Interactive Reinforcement Learning Foundation

2025/07/06
Optimization Algorithms: SGD, Momentum, and Adam

2025/07/05
Building a Japanese BPE Tokenizer: From Characters to Subwords
2024/06/19
Create A Simple and Dynamic Tooltip With Svelte and JavaScript
2024/06/17
Create an Interactive Map of Tokyo with JavaScript

2024/06/14
How to Easily Fix Japanese Character Issue in Matplotlib

2024/06/13
Book Review | Talking to Strangers: What We Should Know about the People We Don't Know by Malcolm Gladwell

2024/06/07
Most Commonly Used 3,000 Kanjis in Japanese

2024/06/07
Replace With Regex Using VSCode

2024/06/06
Do Not Use Readable Store in Svelte
2024/06/05
Increase Website Load Speed by Compressing Data with Gzip and Pako

2024/05/31
Find the Word the Mouse is Pointing to on a Webpage with JavaScript

2024/05/29
Create an Interactive Map with Svelte using SVG

2024/05/28
Book Review | Originals: How Non-Conformists Move the World by Adam Grant & Sheryl Sandberg

2024/05/27
How to Algorithmically Solve Sudoku Using Javascript

2024/05/26
How I Increased Traffic to my Website by 10x in a Month

2024/05/24
Life is Like Cycling

2024/05/19
Generate a Complete Sudoku Grid with Backtracking Algorithm in JavaScript

2024/05/16
Why Tailwind is Amazing and How It Makes Web Dev a Breeze

2024/05/15
Generate Sitemap Automatically with Git Hooks Using Python

2024/05/14
Book Review | Range: Why Generalists Triumph in a Specialized World by David Epstein

2024/05/13
What is Svelte and SvelteKit?

2024/05/12
Internationalization with SvelteKit (Multiple Language Support)

2024/05/11
Reduce Svelte Deploy Time With Caching

2024/05/10
Lazy Load Content With Svelte and Intersection Oberver

2024/05/10
Find the Optimal Stock Portfolio with a Genetic Algorithm
2024/05/09
Convert ShapeFile To SVG With Python
2024/05/08
Reactivity In Svelte: Variables, Binding, and Key Function

2024/05/07
Book Review | The Art Of War by Sun Tzu

2024/05/06
Specialists Are Dead. Long Live Generalists!

2024/05/03
Analyze Voter Behavior in Turkish Elections with Python

2024/04/30
Make Infinite Scroll With Svelte and Tailwind

2024/04/29
How I Reached Japanese Proficiency In Under A Year

2024/04/25
Use-ready Website Template With Svelte and Tailwind

2024/01/29
Lazy Engineers Make Lousy Products

2024/01/28
On Greatness

2024/01/28
Converting PDF to PNG on a MacBook

2023/12/31
Recapping 2023: Compilation of 24 books read

2023/12/30
Create a Photo Collage with Python PIL

2024/01/09
Detect Device & Browser of Visitors to Your Website

2024/01/19
Anatomy of a ChatGPT Response
